. 2021 Jan 25;10:e55701. doi: 10.7554/eLife.55701

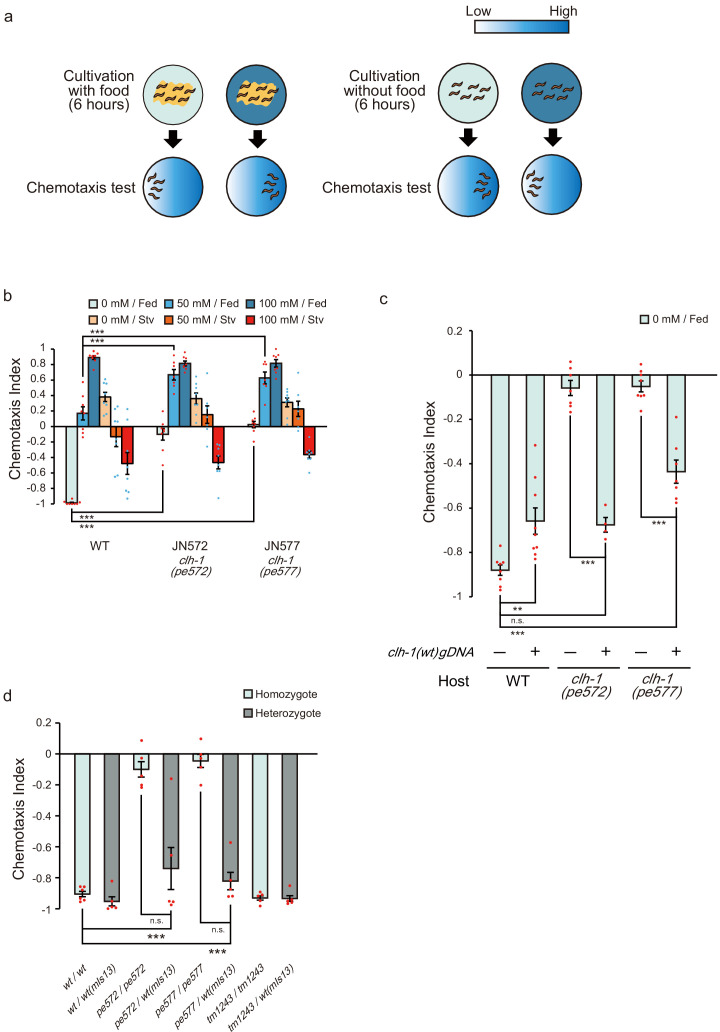
Figure 1. Two missense mutations in clh-1 give rise to food-associated salt chemotaxis disorder.

(a) Salt concentration chemotaxis of wild type. Adult hermaphrodites were cultivated at 0 mM or 100 mM of NaCl with or without food for 6 hr and placed on a chemotaxis assay plate on which NaCl gradient was created. Distribution of animals was quantified by calculating a chemotaxis index. See Materials and methods for details. (b) Chemotaxis of wild-type animals and two mutants obtained from screening, JN572: clh-1(pe572) and JN577: clh-1(pe577). Dots represent individual trials. Bars and the error bars represent mean +/- s.e.m., n = 8 assays, Dunnett’s test, ***p<0.001. (c) Rescue of clh-1(pe572) and clh-1(pe577) mutants by a clh-1 genomic DNA fragment. Dots represent individual trials. Bars and the error bars represent mean +/- s.e.m., n ≧ 4, Tukey’s test, ***p<0.001, **p<0.01, n.s. not significant. (d) Chemotaxis of clh-1 heterozygotes. clh-1 homozygotes were crossed with a clh-1(wt) reporter strain that express GFP in pharyngeal muscle (mIs13). Resulted F1 animals were used for assay. Dots represent individual trials. Bars and the error bars represent mean +/- s.e.m., n ≧ 4, Tukey’s test, ***p<0.001, n.s. not significant.

Figure 1.

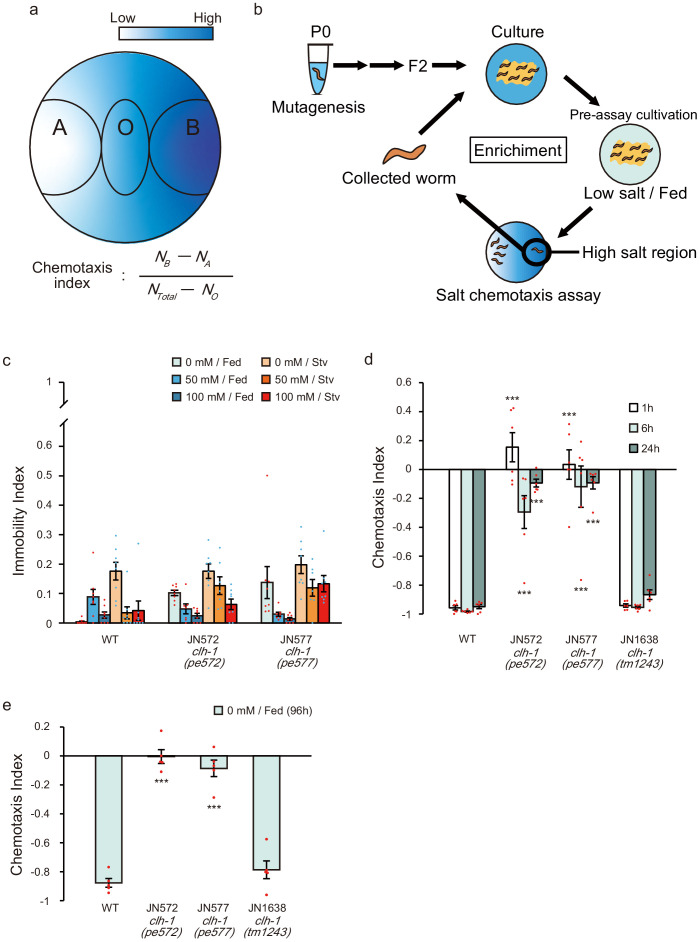
Figure 1—figure supplement 1. Isolation and characterization of salt chemotaxis mutants JN572 and JN577.

Figure 1—figure supplement 1.

(a) A schematic diagram of salt chemotaxis assay plate and calculation of the chemotaxis index. See Materials and methods for details. (b) Procedure for forward genetic screening to obtain food-associated salt chemotaxis mutants. Wild-type animals were mutagenized with ethyl methanesulfonate (EMS), and F2 animals were applied for salt chemotaxis assay. Animals that showed defective chemotaxis were isolated and propagated for another round of test to enrich the ratio of mutants. (c) Immobility index of wild type, JN572 and JN577 on chemotaxis assay plate. Dots represent individual trials. Bars and the error bars represent mean +/- s.e.m., n = 8 assays. (d and e) Chemotaxis of wild type and clh-1 mutants after different duration of pre-assay cultivation. Animals were fed at 0 mM NaCl for 1, 6 or 24 hr (d) or 96 hr (from birth until just prior to assay, e) and tested for salt chemotaxis assay. Dots represent individual trials. Bars and the error bars represent mean +/- s.e.m., n ≧ 6, compared with wild type, Dunnett’s test, ***p<0.001.

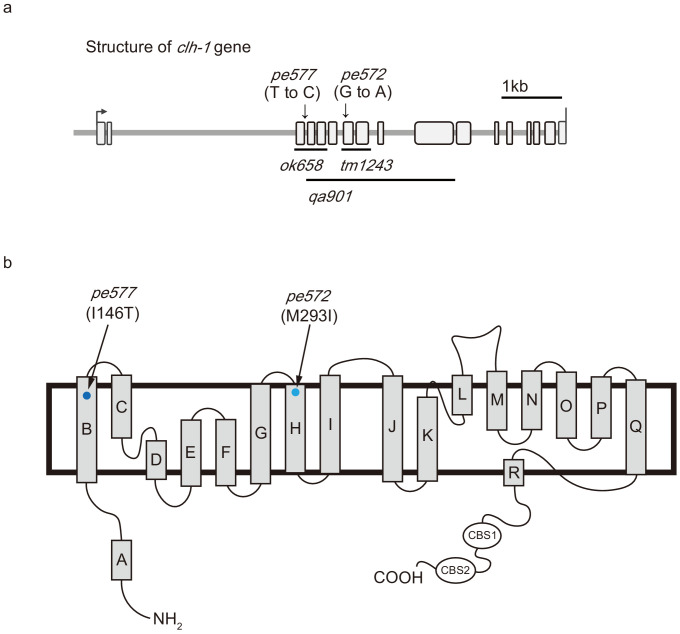
Figure 1—figure supplement 2. Missense mutations in clh-1 responsible for salt chemotaxis defect.

Figure 1—figure supplement 2.

(a) Gene structure of clh-1 and the positions of clh-1 mutations. The positions of pe572 (T to C) and pe577 (G to A) are noted by arrows. ok658 removes exons 3– 5, tm1243 removes exons 6 and 7, qa901 removes exons 4–10. (b) A schematic diagram of protein structure of CLH-1, which is based on structural studies for ClCs (Duran et al., 2009; Dutzler et al., 2003; Dutzler et al., 2002; Feng et al., 2010; Jentsch, 2008; Miyazaki et al., 2012; Wang et al., 2019). Gray rectangles represent α-helices. The positions of pe572 (I146T) and pe577 (M293I) are noted by arrows. CBS1 and CBS2 indicate cystathionine beta synthase domains, which are known as protein-binding domains.

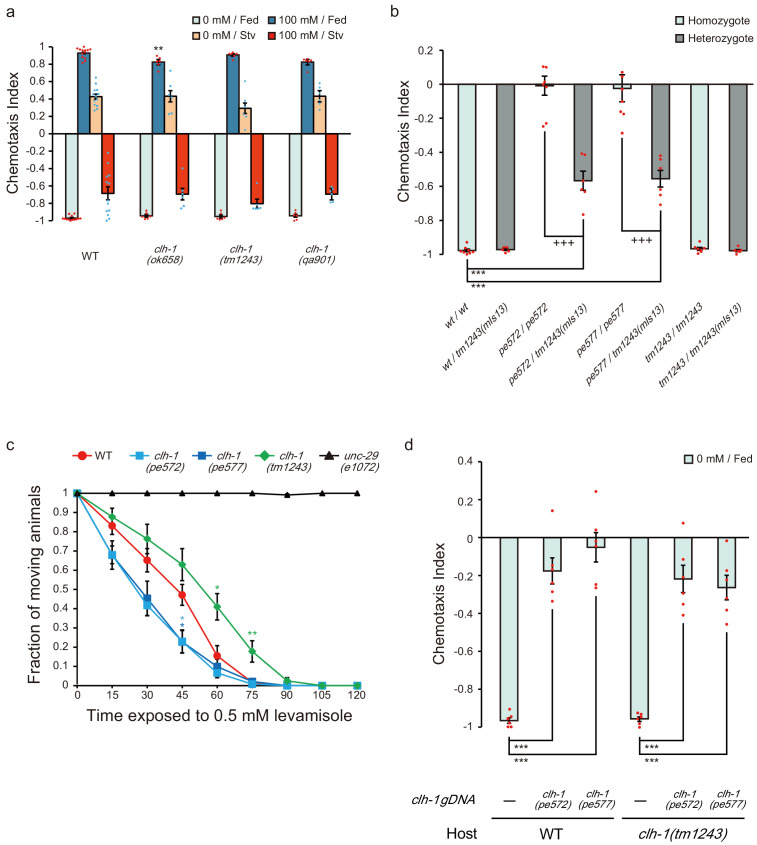
Figure 1—figure supplement 3. Characterization of clh-1 mutants.

Figure 1—figure supplement 3.

(a) Chemotaxis of clh-1 deletion mutants. Dots represent individual trials. Bars and the error bars represent mean +/- s.e.m., n ≧ 6 assays, compared with wild type, Dunnett’s test, **p<0.01. (b) pe572 and pe577 show haploinsufficiency. For generating heterozygotes, hermaphrodites of either wild type, clh-1(pe572), clh-1(pe577) or clh-1(tm1243) were crossed with clh-1(tm1243) males which express GFP in pharyngeal muscle (mIs13), and F1 animals were used for the assay. Dots represent individual trials. Bars and the error bars represent mean +/- s.e.m., n ≧ 5, Tukey’s test, ***p<0.001, compared with wild-type homozygote. +++p<0.001, compared with each original missense allele homozygote. (c) Levamisole resistance test. The graph shows fraction of non-paralyzed (moving) animals at the indicated time points on 0.5 mM levamisole. Mean +/- s.e.m., n = 6 assays, compared with wild type, Dunnett’s test, **p<0.01, *p<0.05. Asterisks are colored according to the strain (light blue for clh-1(pe572), deep blue for clh-1(pe577), and green for clh-1(tm1243)). (d) Excess genomic DNA fragments of clh-1(pe572) or clh-1(pe577) recapitulate salt chemotaxis defect in wild type and clh-1(tm1243). Dots represent individual trials. Bars and the error bars represent mean +/- s.e.m., n = 6 assays, Tukey’s test, ***p<0.001.