. 2021 Jan 25;10:e55701. doi: 10.7554/eLife.55701

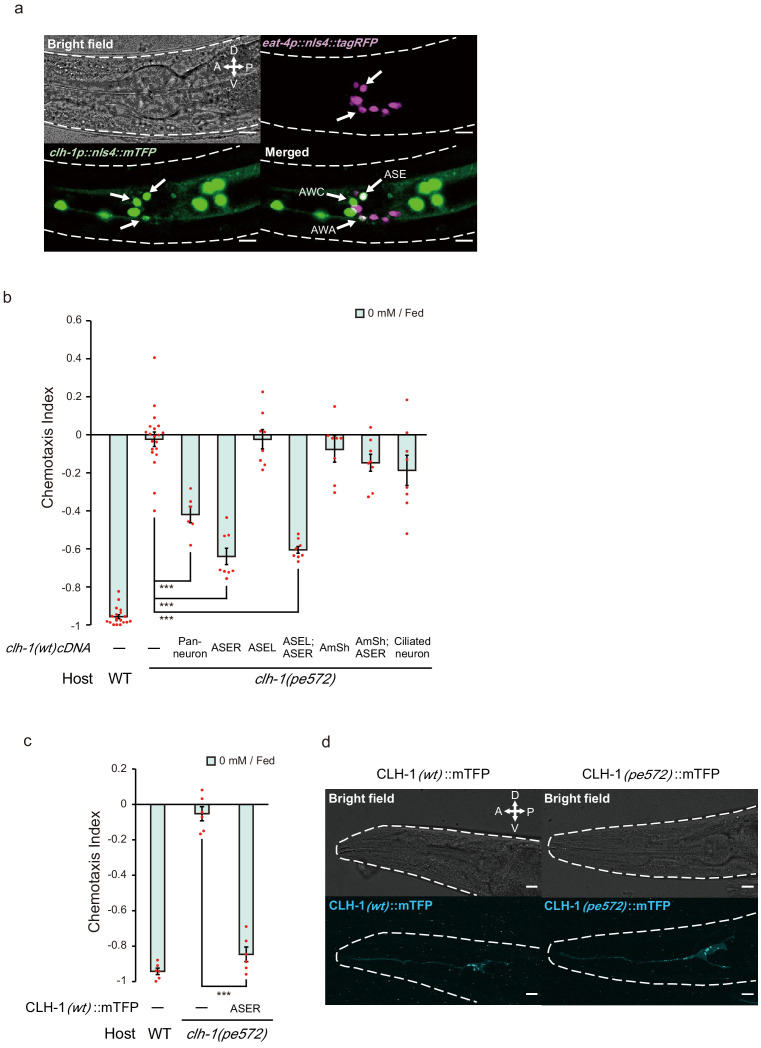
Figure 3. clh-1 acts in the salt-sensing neuron ASER.

(a) Expression pattern of clh-1p::nls4::mTFP (green, bottom left) in an adult animal. At least three pairs of sensory neurons, AWA, AWC and ASE expressed the marker. eat-4p::nls4::tagRFP and DiI, that marks glutamatergic neurons (magenta, top right) and six pairs of head sensory neurons (not shown), respectively, were used as position markers for cell identification. Scale bar = 10 µm. (b) Rescue of clh-1(pe572) mutants by cell-specific expression of clh-1(wt) cDNA. Promoters used in this experiment are as follows; rimb-1p for all neurons, gcy-5p for ASER, gcy-7p for ASEL, vap-1p for amphid sheath cells, dyf-11p for ciliated neurons. Dots represent individual trials. Bars and the error bars represent mean +/- s.e.m., n ≧ 6 assays, Tukey’s test. ***p<0.001. (c) Chemotaxis of clh-1(pe572) mutants that express clh-1(wt)cDNA::mTFP in ASER. mTFP-tagged CLH-1 is functional. Dots represent individual trials. Bars and the error bars represent mean +/- s.e.m., n = 6, Tukey’s test. ***p<0.001. (d) Subcellular localization of CLH-1 in ASER. Panels show gcy-5p::clh-1(wt)cDNA::mTFP in wild type (left) and gcy-5p::clh-1(pe572)cDNA::mTFP in clh-1(pe572) (right). Both CLH-1(wt)::mTFP and CLH-1(pe572)::mTFP localized to the membrane of dendrite, soma, axon, and cell organelles. Scale bar = 10 µm.

Figure 3.

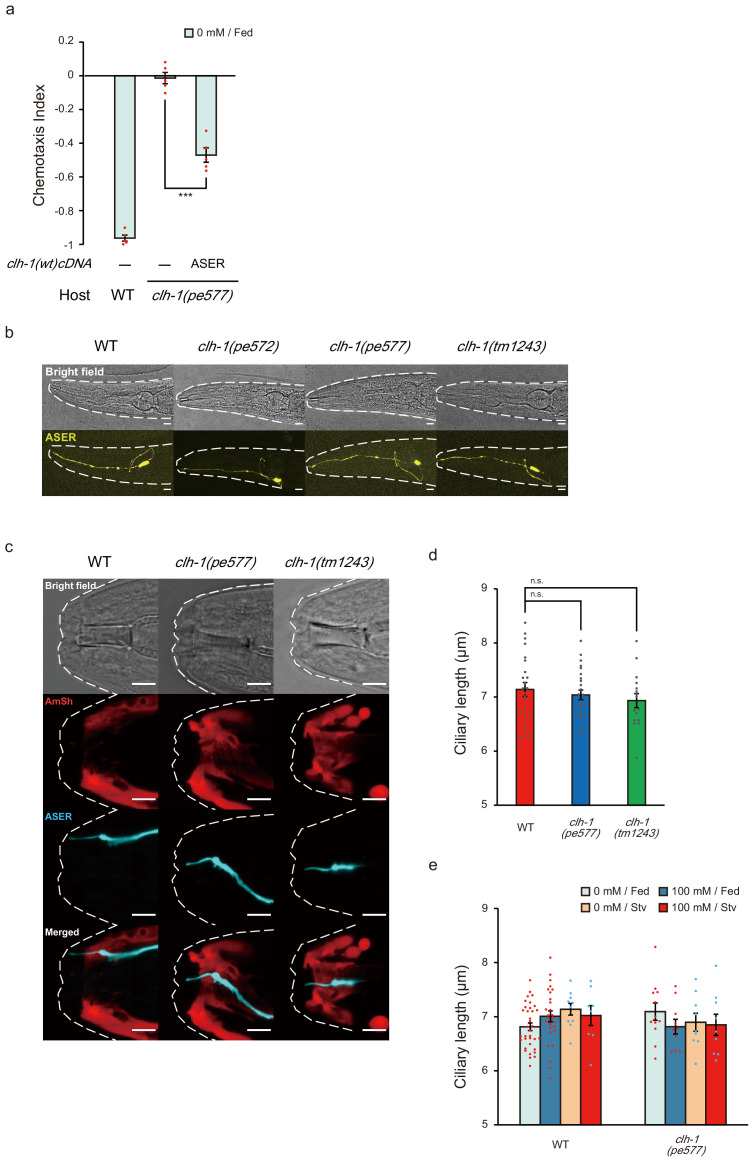
Figure 3—figure supplement 1. clh-1 acts in ASER in salt chemotaxis, and mutations in clh-1 do not affect morphology of ASER.

Figure 3—figure supplement 1.

(a) Rescue of clh-1(pe577) mutants by ASER-specific expression of clh-1(wt) cDNA. Dots represent individual trials. Bars and the error bars represent mean +/- s.e.m., n = 5 assays, Tukey’s test. ***p<0.001. (b) Morphology of ASER in wild-type and clh-1 adult animals visualized by gcy-5p::GFP. No gross morphological defect was observed in the mutants. Animals were anesthetized by 10 mM NaN3. Bright-field (top) and stacked confocal fluorescence images (bottom). Scale bar = 10 µm. (c) Confocal images of ASER sensory cilium and amphid sheath glial cells in adult animals. Top; bright field, second top; AmSh (vap-1p::mCherry, red), second bottom; ASER (gcy-5p::mTFP, cyan), bottom; merged. Animals were anesthetized by 100 μM levamisole. Scale bar = 5 µm. (d) Length of ASER sensory cilium in adult animals. Animals were anesthetized by 100 μM levamisole and ciliary length was measured from confocal images. Mean +/- s.e.m., dots represent individual trials. n ≧ 16 animals, Dunnett’s test, n.s. not significant. (e) Length of ASER sensory cilium in adult animals after cultivation at the indicated conditions. Animals were anesthetized by 100 μM levamisole. Ciliary length was measured from confocal images. Mean +/- s.e.m., dots represent individual trials. n ≧ 8 animals.