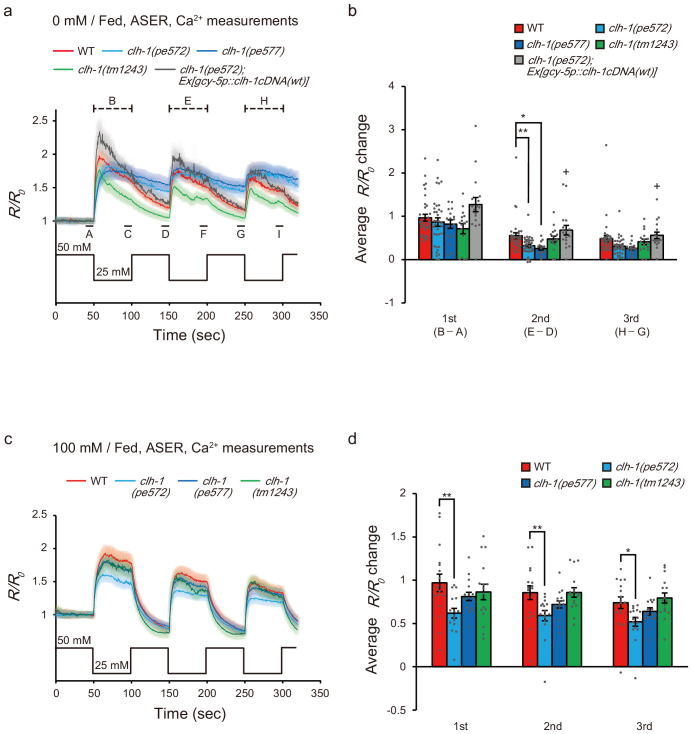
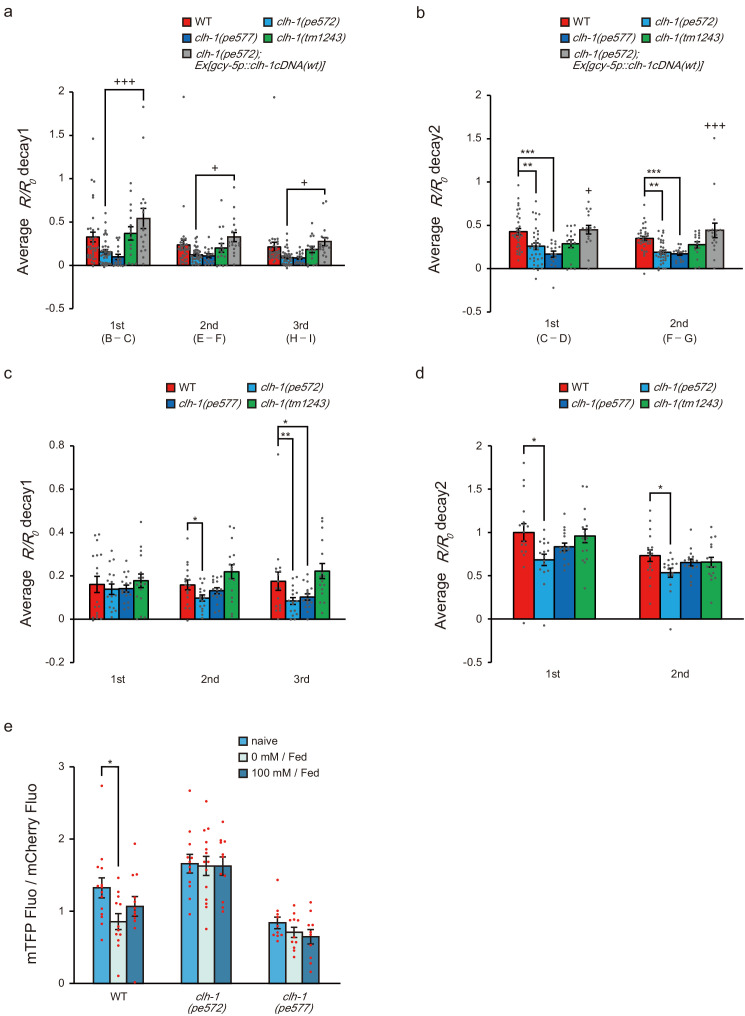
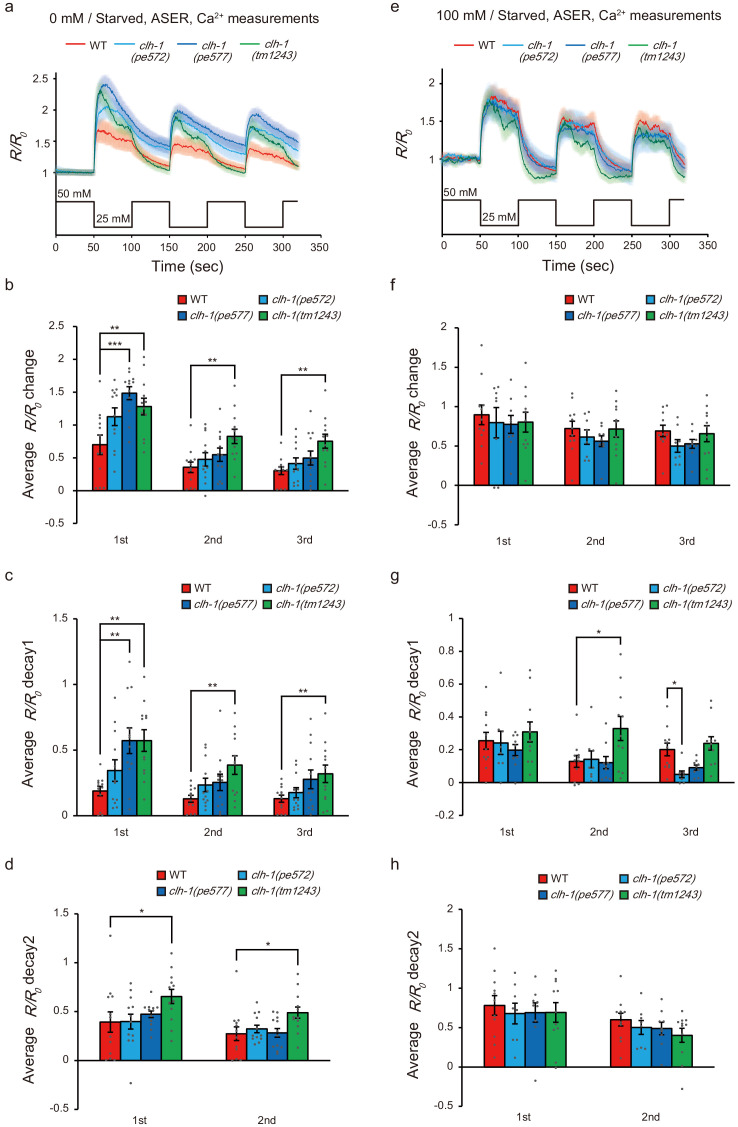
Figure 5. Calcium dynamics of ASER in response to repeated salt stimuli is altered in clh-1 mutants.
(a and c) Calcium responses of ASER stimulated by NaCl concentration changes between 50 mM and 25 mM after cultivation at 0 mM NaCl (a) or 100 mM NaCl (c) in the presence of food for 6 hr. A to I indicate the time points for calculation of R/R0 changes. A, D, and G are the time points for pre-stimulus R/R0, B, E, and H are the time points for peak R/R0 during stimulation, C, F, and I are the time points for decayed R/R0 during stimulation. The shaded region represents s.e.m., n ≧ 16 animals. (b and d) R/R0 changes at each NaCl down-step stimulus (B - A, E - D, and H - G for the 1st, 2nd, and 3rd stimulus, respectively). 0 mM NaCl cultivated (b) or 100 mM cultivated (d). See Materials and methods for details. Bars and the error bars represent mean +/- s.e.m., dots represent individual trials. n ≧ 16 animals, Tukey’s test, **p<0.01, *p<0.05. +p<0.05, compared with clh-1(pe572) mutant.


