. 2021 Jan 25;10:e55701. doi: 10.7554/eLife.55701

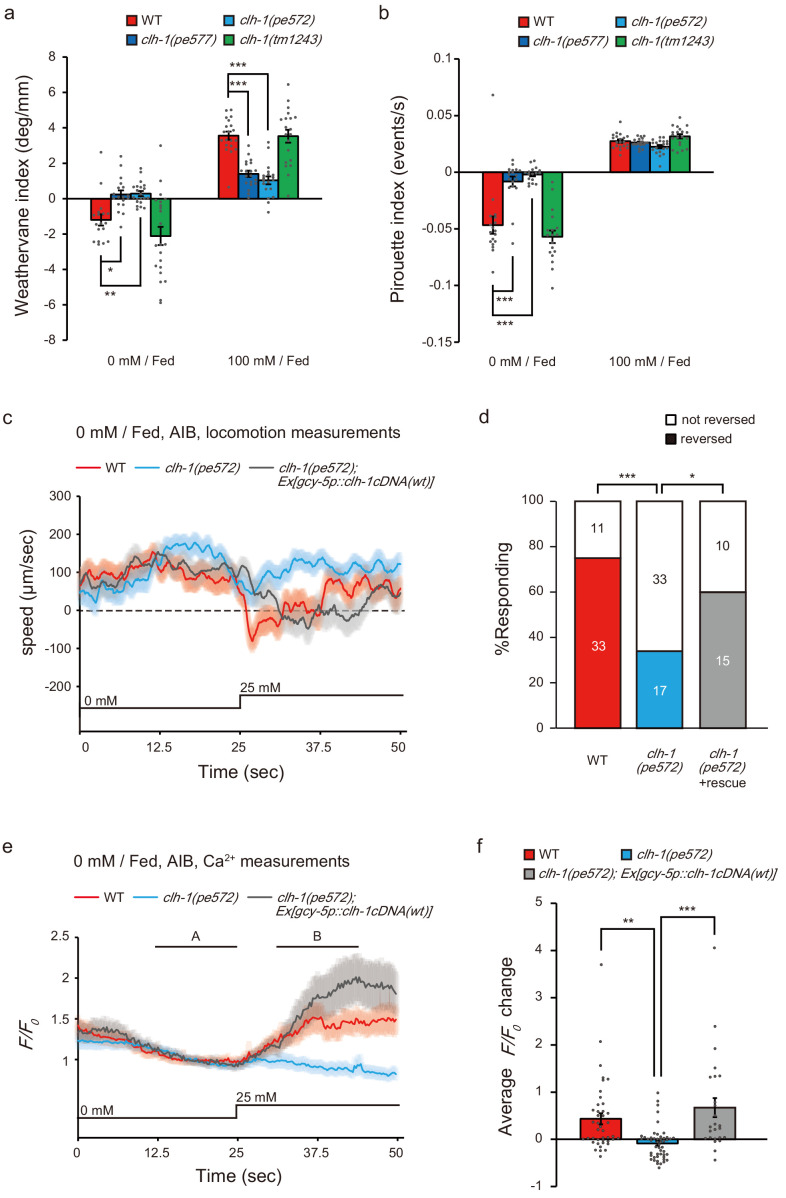
Figure 6. Missense mutations in clh-1 attenuate both klinotaxis and klinokinesis, as well as AIB response and reversal in response to salt increase.

(a and b) clh-1(pe) mutants show defects in migration bias in salt chemotaxis. Bias of klinotaxis (a) and klinokinesis (b), represented by weathervane index and pirouette index, respectively. In both mechanisms, positive and negative values indicate migration bias toward higher and lower salt concentrations, respectively. Bars and the error bars represent mean +/- s.e.m., dots represent individual trials. n ≧ 18 assays, Dunnett’s test, ***p<0.001, **p<0.01, *p<0.05. (c and e) Locomotion speed of animals (c) and calcium responses of AIB (e) after cultivation at 0 mM NaCl in the presence of food. In panel (e), A and B indicate the time points for calculation of F/F0 changes. NaCl concentration change from 0 mM to 25 mM at 25 s. The shaded region represents s.e.m., n ≧ 25 animals. (d) Proportion of animals that showed reversal after salt stimulus. Reversal was defined as follows; backward locomotion, whose velocity less than −100 µm/sec was continued for more than 1 s (35 frames). The error bars represent s.e.m., n ≧ 25 animals, Fisher’s exact test. ***p<0.001, *p<0.05. (f) F/F0 change upon salt stimulus (B - A, see Materials and methods for details). Bars and the error bars represent mean +/- s.e.m., dots represent individual trials. n ≧ 25 animals, Tukey’s test, ***p<0.001, **p<0.01.

Figure 6.

Figure 6—figure supplement 1. Quantification of the navigation behaviors.
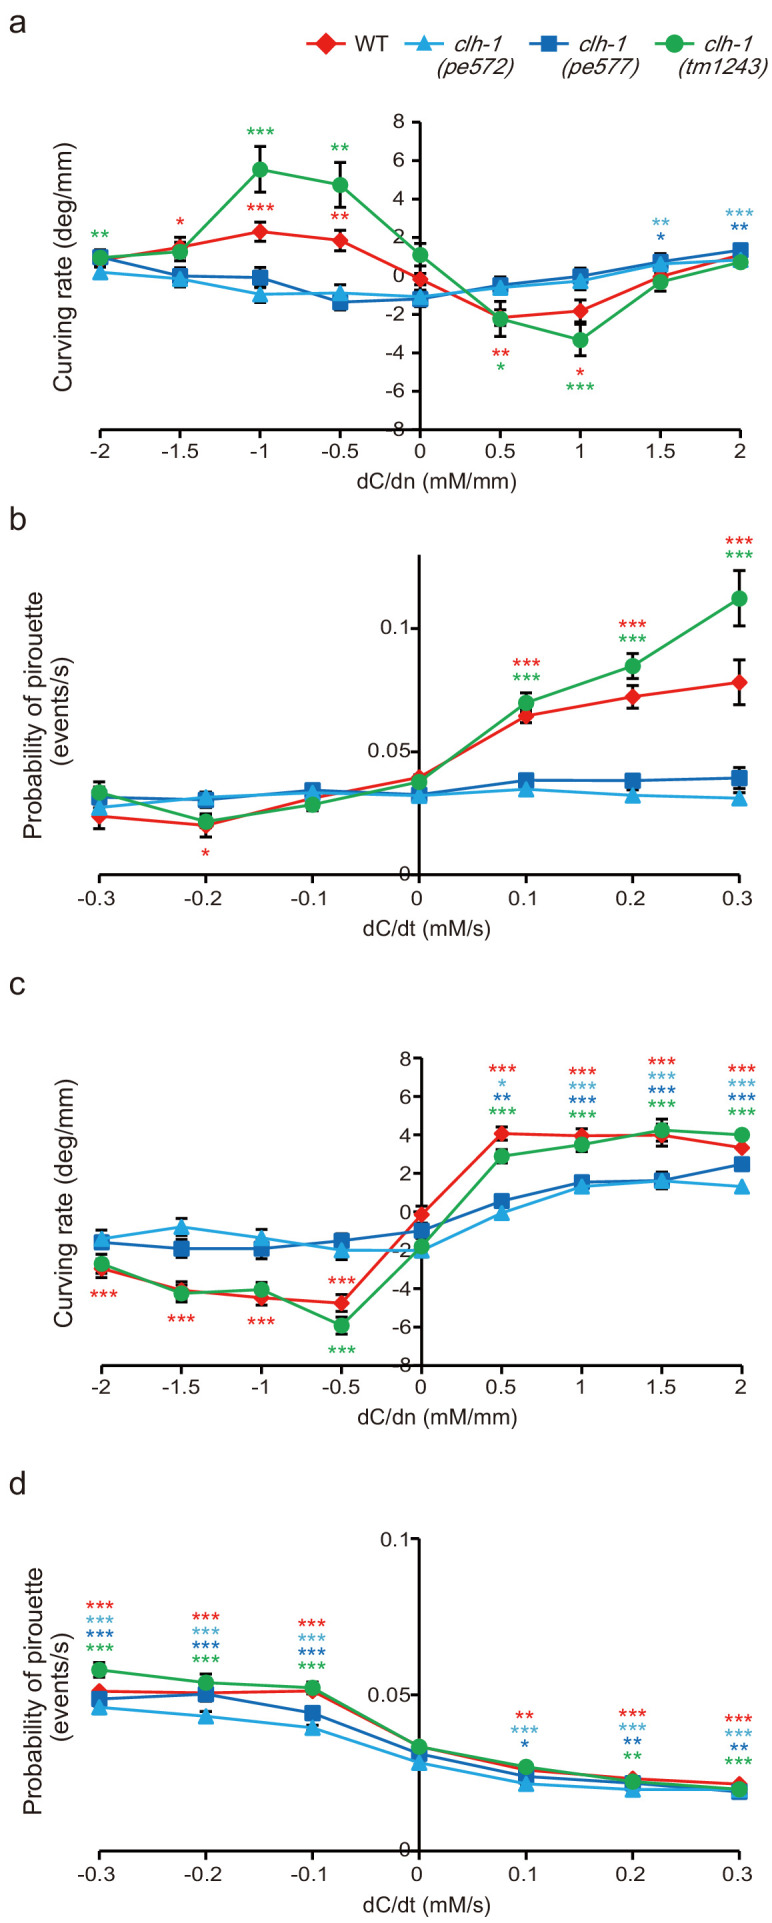
Figure 6—figure supplement 1.

(a and b) Chemotaxis after cultivation at 0 mM NaCl in the presence of food. Klinotaxis bias represented by curving rate (a) and klinokinesis bias represented by probability of pirouette (b). dC/dn represents spatial gradient of NaCl concentration perpendicular to the direction of centroid movement of the animal. Note that migration biases in both klinotaxis and klinokinesis toward low salt are weak in the clh-1(pe) mutants. The error bars represent s.e.m., n ≧ 18 animals, compared with the basal weathervane index (dC/dn = 0) or the basal pirouette index (dC/dt = 0), Dunnett’s test, ***p<0.001, **p<0.01, *p<0.05. Asterisks are colored according to the strain (red for wild type, light blue for clh-1(pe572), deep blue for clh-1(pe577), green for clh-1(tm1243)). (c and d) Chemotaxis after cultivation at 100 mM NaCl in the presence of food. Migration bias of klinotaxis (c) and klinokinesis (d). Klinotaxis, but not klinokinesis toward high salt is weak in the clh-1(pe) mutants. The error bars represent s.e.m., n ≧ 19 animals, compared with the basal weathervane index (dC/dn = 0) or the basal pirouette index (dC/dt = 0), Dunnett’s test, ***p<0.001, **p<0.01, *p<0.05. Asterisks are colored according to the strain.
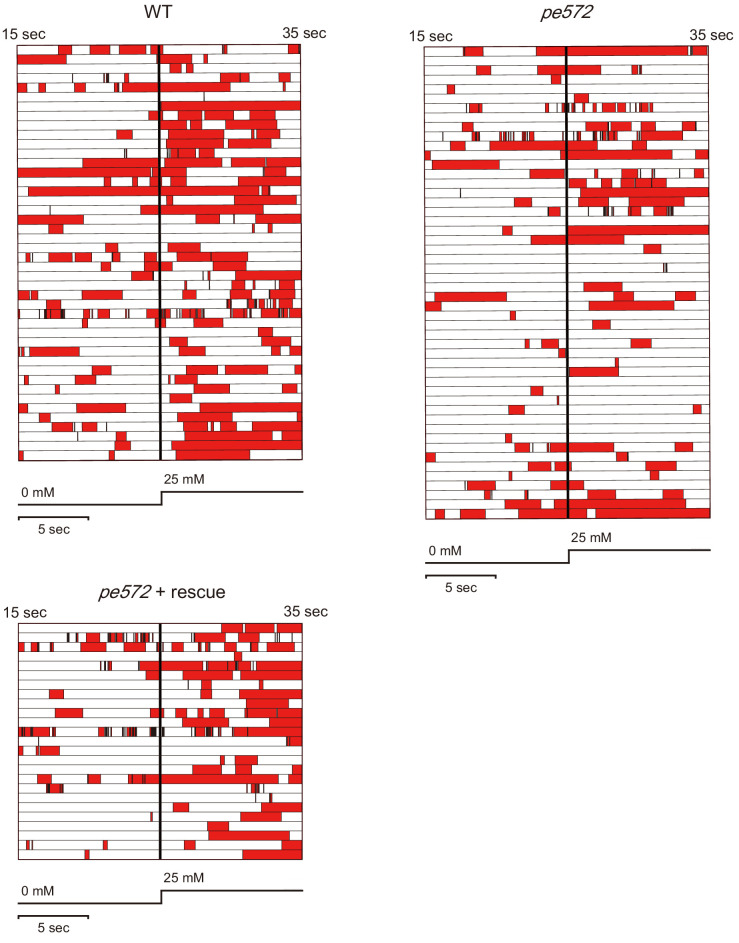
Figure 6—figure supplement 2. Quantification of reversal behaviors in microfluidics arena.

Figure 6—figure supplement 2.

Locomotion of wild type, clh-1(pe572), and clh-1(pe572) that express clh-1(wt) cDNA in ASER (pe572 + rescue). Locomotion of animals was categorized as either forward (white) or reversal (red). Twenty second recordings, consisting of each 10 s of before and after salt up-step stimulus (bold bar), were aligned. Each row represents each individual. n ≧ 25 animals.