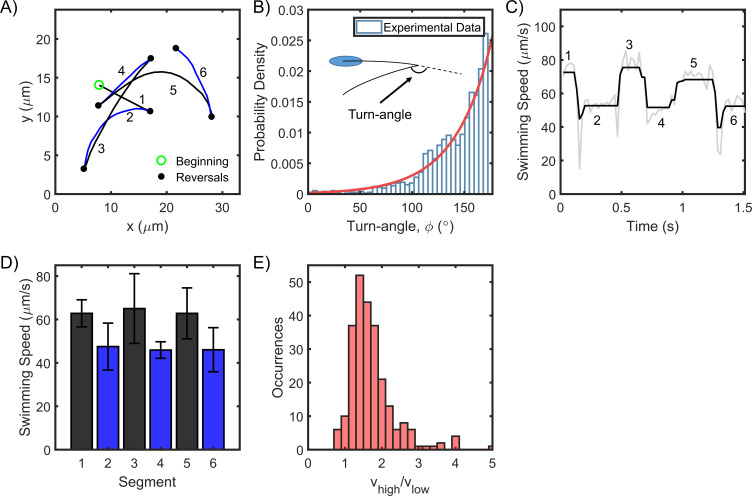
Figure 1. H. pylori swim forward and backward at different speeds.
(A) Representative swimming trace of a single bacterium. Each reversal is represented by a filled circle. The beginning of the trajectory is denoted by an open circle. Uninterrupted swimming between two reversals was labeled as a segment and the segments were numbered chronologically. (B) The turn angles were exponentially distributed (n = 1653 samples); reversals mostly caused the cells to retrace their movements. (C) The swimming speed for a single cell over 1.5 s is indicated. The speeds alternated between high and low values with each reversal. Raw data is indicated in gray; filtered data is indicated in black. (D) The mean speed for each segment is indicated chronologically. Standard deviations are indicated. (E) The mean speed for the high (low) mode for each cell was calculated by averaging over all its high- (low-) speed segments. The distribution of the ratios of the high and low mean speeds for each cell is indicated. The mean ratio was 1.5 ± 0.4 (n = 250 cells).

