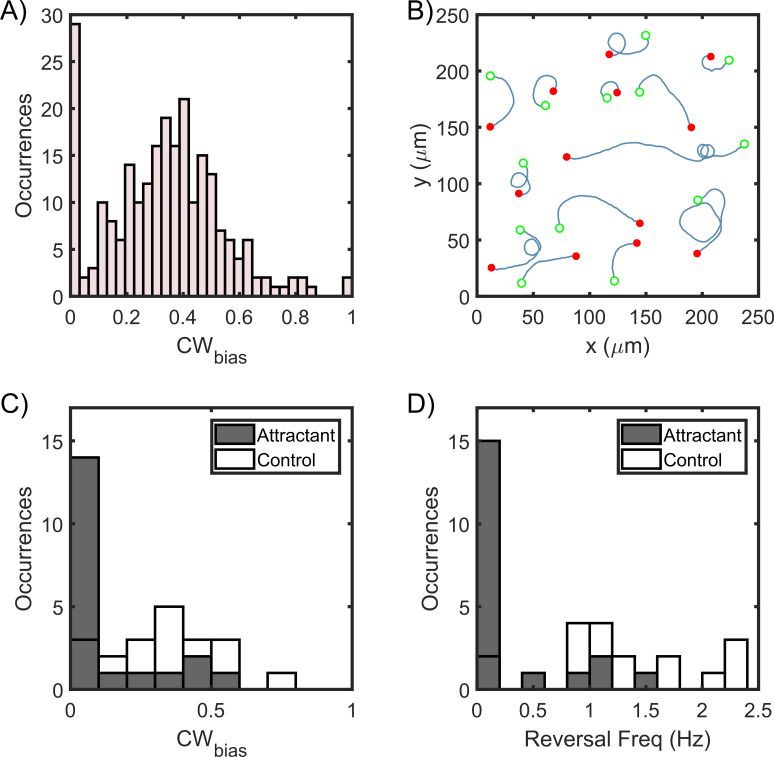
Figure 3. Asymmetric swimming speeds enable quantification of chemotaxis output.
(A) CWbias was determined at 37°C in the absence of chemical stimulants. Cell trajectories with durations of 1 s or more were considered for calculation. The distribution was obtained from n = 240 cells. A Gaussian fit to the switching population (n = 212 cells) yielded CWbias = 0.35 ± 0.23 (mean ± standard deviation). (B) Single-cell trajectories of a ΔcheY mutant are indicated. Cells swam in CW-only trajectories, which indicate CCW flagellar rotation. Open green circles denote the start of a trajectory; filled red circles denote the end. The trajectories were spatially displaced to group them for the purpose of illustration and truncated to show the direction of rotation. Full trajectories and additional cells are included in Appendix 1—figure 1. (C) The post-stimulus CWbias was monitored for ~30–60 s immediately following exposure to 20 mM urea (n = 20 cells); 14 cells swam exclusively in the pusher mode during the period of observation and displayed CW-only trajectories near surfaces. In the control case, cells were exposed to the buffer-only. The average post-stimulus CWbias was 0.31 ± 0.04 (mean ± standard error, n = 20 cells). The difference in the mean bias for the attractant and the control cases was significant (p-value<0.001). (D) The post-stimulus reversal frequency for cells treated with urea was 0.23 ± 0.09; those treated with the buffer had an average reversal frequency of 1.4 ± 0.04. The difference in the mean frequency for the attractant and the control cases was significant (p-value<0.001).

