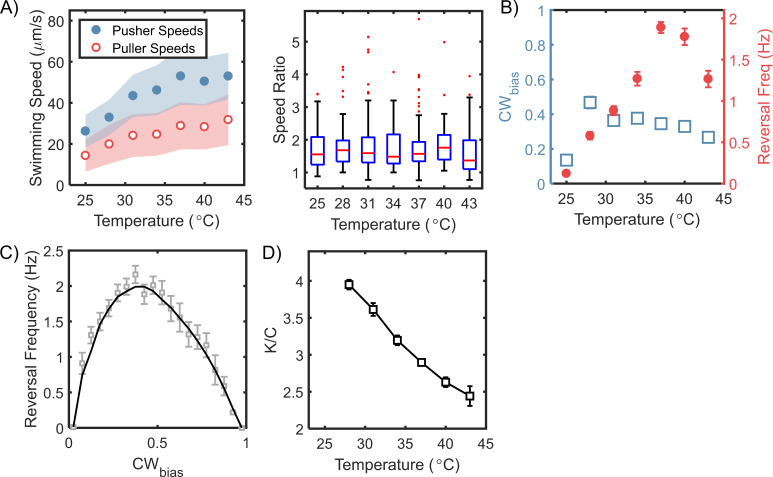
Figure 4. Steady-state chemotactic output is independent of temperature.
(A) Left: Swimming speeds for each mode are plotted (mean ± standard deviation) for different temperatures. The speeds increased with temperature till 37°C, after which they plateaued. The shaded regions indicate standard deviation. Right: The ratios of the pusher and puller speeds are independent of the temperatures, as indicated. A red horizontal line indicates the median ratio at each temperature, and the bottom and top borders of the encompassing box indicate the 25th and 75th percentiles. The extended lines span 99.3% of the data and the dots indicate outliers. (B) Mean CWbias (open squares) and mean reversal frequencies (filled circles) are plotted over a range of temperatures. The switching frequency was at a maximum at the physiological temperature (37°C) and decreased at higher and lower temperatures. The CWbias increased with the temperature and plateaued above 30°C. The mean values are indicated with standard error. Each data-point was averaged over n ≥ 80 cells. (C) The relationship between reversal frequency and CWbias is indicated. The values were obtained from the combined datasets over the entire range of temperatures that we studied (n = 972 cells). The CWbias was binned (bin size = 0.05), and the mean reversal frequency for each bin was estimated. The mean and standard errors are indicated in grey. The black curve is a guide to the eye. (D) The estimated ratio of the CheY-P dissociation constant () and the intracellular CheY-P concentrations () is indicated as a function of the temperature. The ratios were calculated from the data in (B) following a previous approach (Turner et al., 1999). The number of binding sites for CheY-P in H. pylori ~ 43 was estimated from the relative sizes of the flagellar C-ring (see Appendix 2 and Qin et al., 2017). The ratio of the dissociation constants for the CCW and the CW motor conformations was assumed to be similar to that in E. coli (~ 4.7 from Fukuoka et al., 2014).

