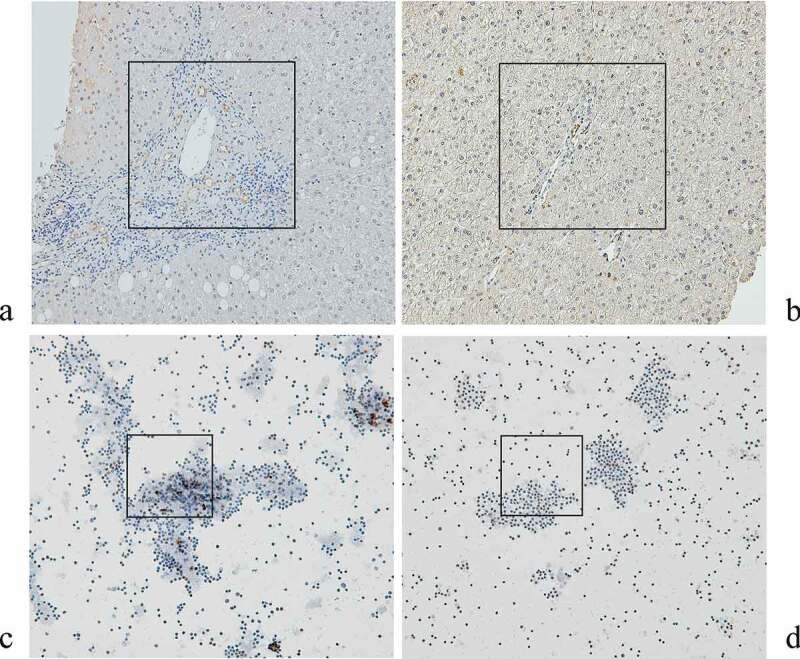
Figure 4.

Immunohistochemistry for eNAMPT in the livers of CHC patients before anti-HCV therapy (a) and of control subjects (b), and in PB smears of isolated leukocytes from CHC patients before (c) and after (d) anti-HCV therapy. eNAMPT-expressing cells are stained brown. The areas that showed the different density of eNAMPT-expressing cells between (A) and (B), as well as that different between (C) and (D) were marked with black frames
