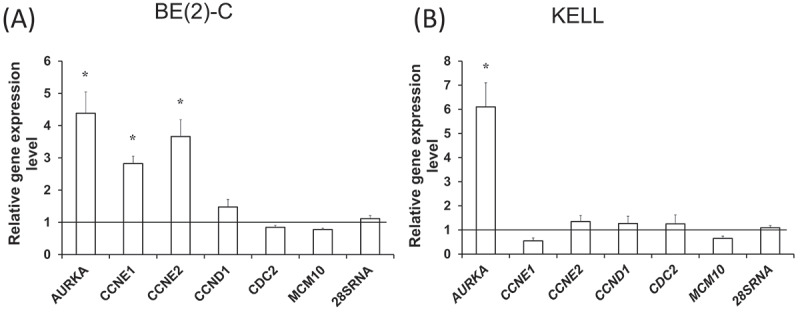
Figure 3.

Assessment of MCPIP1 protein binding of several transcripts in neuroblastoma cells. Evaluation of relative levels of selected transcripts in the RNA immunoprecipitated with MCPIP1-D141N-Flag protein or the Flag tag (negative control) in BE(2)-C (C) and KELLY (D) cells. RPS13 (40S ribosomal protein S13) was used as a reference. All experiments were performed three times. Graphs represent mean ± SEM and were calculated compared to the negative control values, set as 1 (black baseline). For the determination of statistical significance, a T-test was performed. *P < 0.05
