
Figure 6.
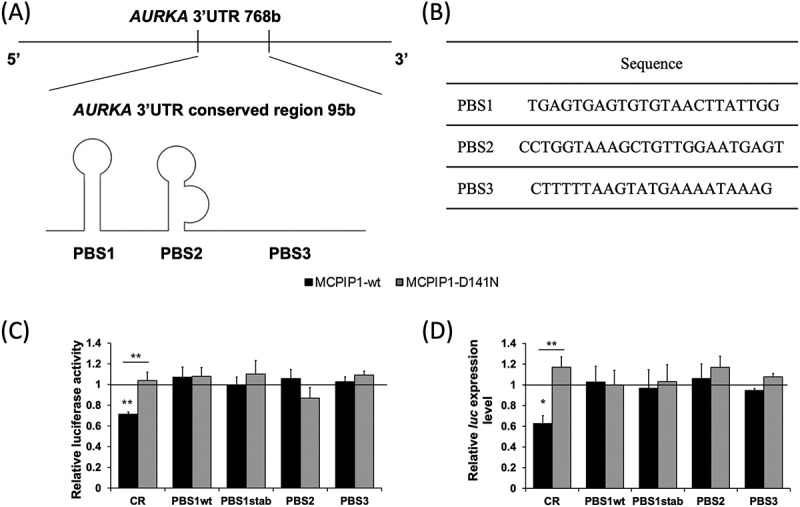
Assessment of stability of the conserved region (CR) of AURKA 3′UTR and putative binding sites (PBS) of MCPIP1 protein in BE(2)-C cells overexpressing MCPIP1. (A) Visualization of AURKA 3′UTR CR position and secondary structure in the 3′UTR. (B) Sequences of MCPIP1 putative binding sites. (C) Relative luciferase activity of BE(2)-C cells co-transfected with MCPIP1-wt, MCPIP1-D141N or control expression vectors and pmiRGlo_AURKA-CR, pmiRGlo_AURKA-PBS1wt, pmiRGlo_AURKA-PBS1stab, pmiRGlo_AURKA-PBS2, or pmiRGlo_AURKA-PBS3 reporter vectors calculated compared to the relative activity of corresponding cells transfected with the empty pmiRGlo vector. (D) Relative luciferase transcript levels in BE(2)-C cells transfected with MCPIP1-wt, MCPIP1-D141N or control expression vectors and pmiRGlo_AURKA-CR, pmiRGlo_AURKA-PBS1wt, pmiRGlo_AURKA-PBS1stab, pmiRGlo_AURKA-PBS2, or pmiRGlo_AURKA-PBS3 reporter vectors assessed by RT-qPCR. Renilla luciferase was used as a reference. All experiments were performed three times. Graphs represent mean ± SEM. Black baseline illustrates values for the control cells (transfected with the empty expression vector), set as 1. The one-way analysis of variance was implemented with Tukey’s post hoc test. MCPIP1-wt, cells transfected with wild type MCPIP1 expression; MCPIP1-D141N, cells transfected with mutated MCPIP1 expression vector; CR, cells transfected with pmiRGlo_AURKA-CR reporter vector; PBS1wt, cells transfected with pmiRGlo_AURKA-PBS1wt reporter vector; PBS1stab, cells transfected with pmiRGlo_AURKA-PBS1stab reporter vector; PBS2, cells transfected with pmiRGlo_AURKA-PBS2 reporter vector; PBS3, cells transfected with pmiRGlo_AURKA-PBS3 reporter vector. **P < 0.01