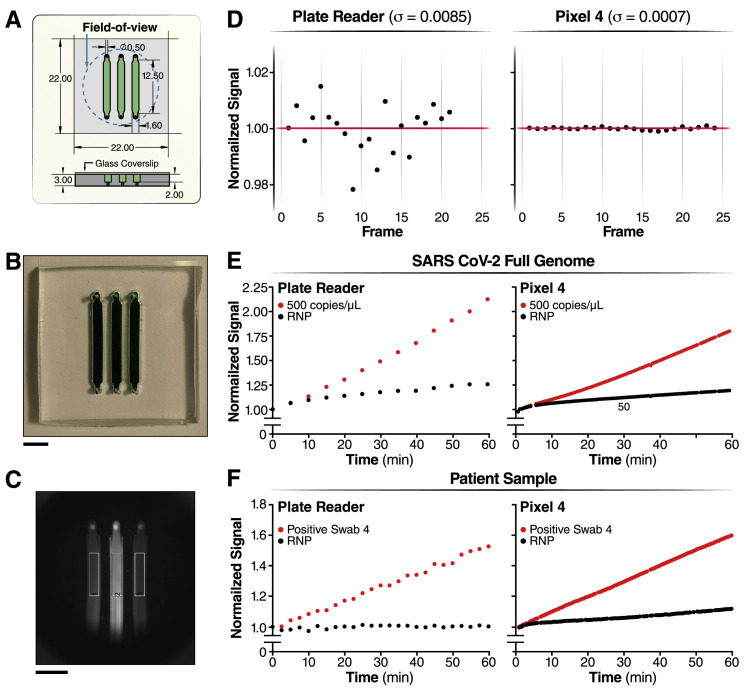
Figure S3.
Comparison of the Cas13a reaction measured in the plate reader and the mobile phone device, related to Figure 4
(A–C) Schematic of the reaction chamber and the sample region-of-interest (ROI)
(A) Reaction chamber dimensions are described here.
(B) Photo of a reaction chamber loaded with an artificial green dye (Scale bar = 5 mm).
(C) Raw image of patient sample and the sample ROIs (black rectangle) (Scale bar = 5 mm).
(D) The measurement error of the plate reader (left) versus the mobile device (right) for typical conditions used for Cas13a reaction (37°C, measurement interval: 30 s).
(E) The triple crRNA combination with 500 copies/μL of genomic SARS CoV-2 viral RNA was measured in the plate reader (left) and in the mobile phone device (right).
(F) The triple crRNA combination with Positive Swab 4 was measured in the plate reader (left) and in the mobile phone device (right).

