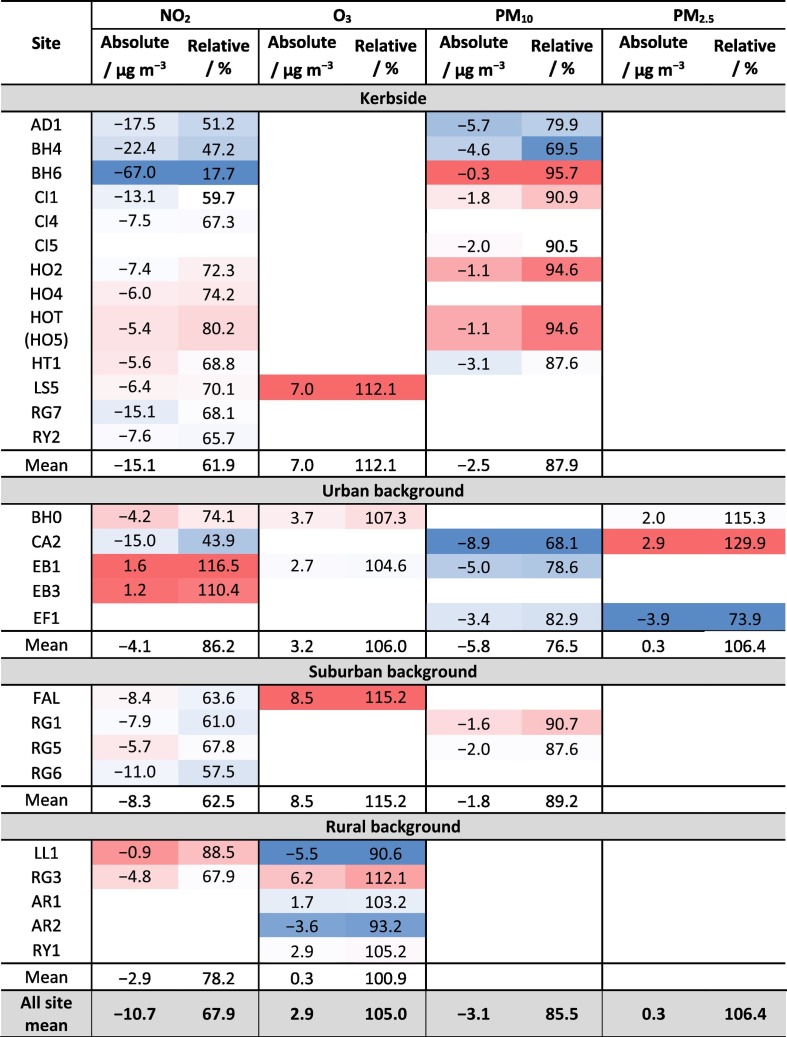
Table 2.
Changes in period mean (i.e. March–May, inclusive) ‘de-weathered’ air pollutant concentrations in the South East of the UK between 2020 (during the pandemic) and the average of the same period over the preceding 5 years (i.e. 2015–2019). Summary statistics by site type are also provided.
Cell colour scale represents the level of change in concentration. The darker the shade of blue, the larger the reduction in concentration for that particular pollutant; lighter shades/white represent the middle of the change scale; the darker reds represent the opposite end of the scale, where concentrations have decreased the least or increased.

