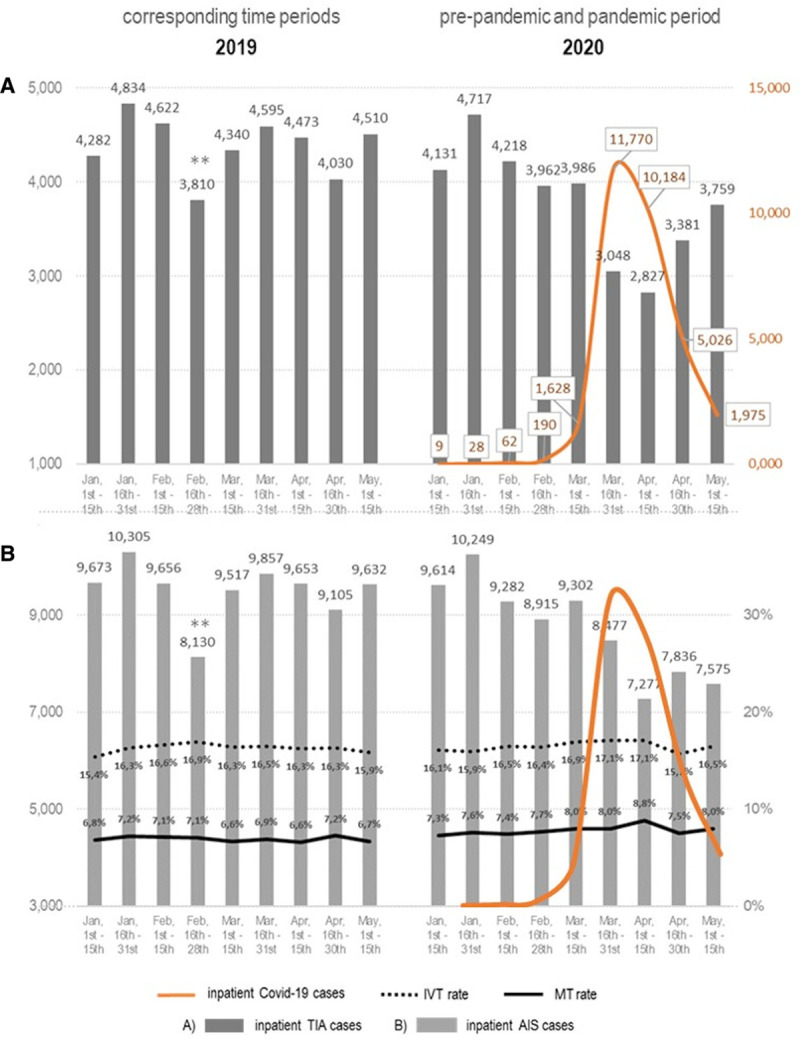
Figure.

Course of hospital admissions of patients with acute cerebrovascular events. Hospitalized patients with transient ischemic attack (TIA; A) and acute ischemic stroke (AIS; B) are demonstrated as bar graphs representing a 2-wk period. Treatments rates are given in percent. Schematic course of the number of hospitalized coronavirus disease 2019 (COVID-19) cases in Germany is given as curve diagram (orange). Apr indicates April; Feb, February; IVT, intravenous thrombolysis; Jan, January; Mar, March; and MT, mechanical thrombectomy. **The 1–3 days shorter period in second half of February 2019 needs to be considered in this comparison.
