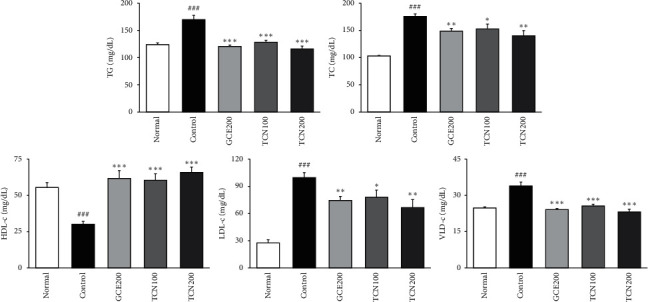
Figure 4.

Biochemical analyses. Normal: normal mice; Control: HFD control mice; GCE200: GCE 200 mg/kg-treated and obese mice; TCN100: TCN 100 mg/kg-treated and obese mice; TCN200: TCN 200 mg/kg-treated and obese mice. Data are the mean ± SD (n = 8). Significance: ###p < 0.001 versus the normal mice. ∗p < 0.05, ∗∗p < 0.01, ∗∗∗p < 0.001 versus the HFD control mice. TG: triglyceride; TC: total cholesterol; LDL-c: low-density lipoprotein-cholesterol; HDL-c: high-density lipoprotein-cholesterol; VLDL-c: very low-density lipoprotein-cholesterol.
