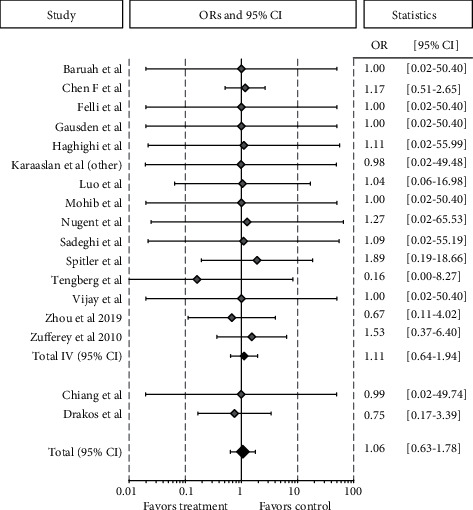
Figure 5.

Forest plot of the 17 studies comparing the VTE rate between the TXA group and the control group for other orthopedic lower limb surgical procedures. Point estimates of the weighted odds ratios for each study are represented by squares, and the 95% CIs are represented by horizontal bars. The summary odds ratio is represented by a black diamond.
