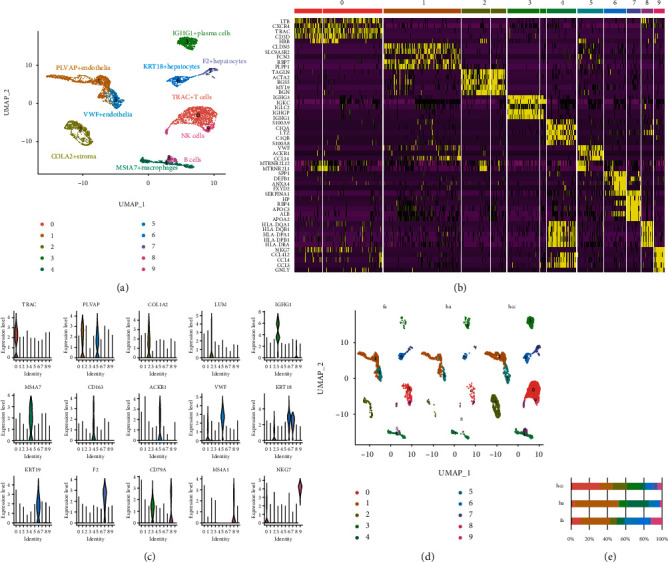
Figure 1.

Single-cell RNA-seq analysis in the liver sample from healthy, fibrosis, and HCC patient. (a) UMAP diagram describes the 10 main cell types in the integrated liver biopsy samples. (b) Heat map annotated the different genes of the 10 main cell types. (c) Violin plots show the expression and distribution of marker genes. (d) Single-cell data of healthy (ha), fibrosis (fa), and HCC (hcc) patients. (e) Bar graphs quantify and compare the proportion of single-cell data of healthy (ha), fibrosis (fa), and HCC (hcc) patients.
