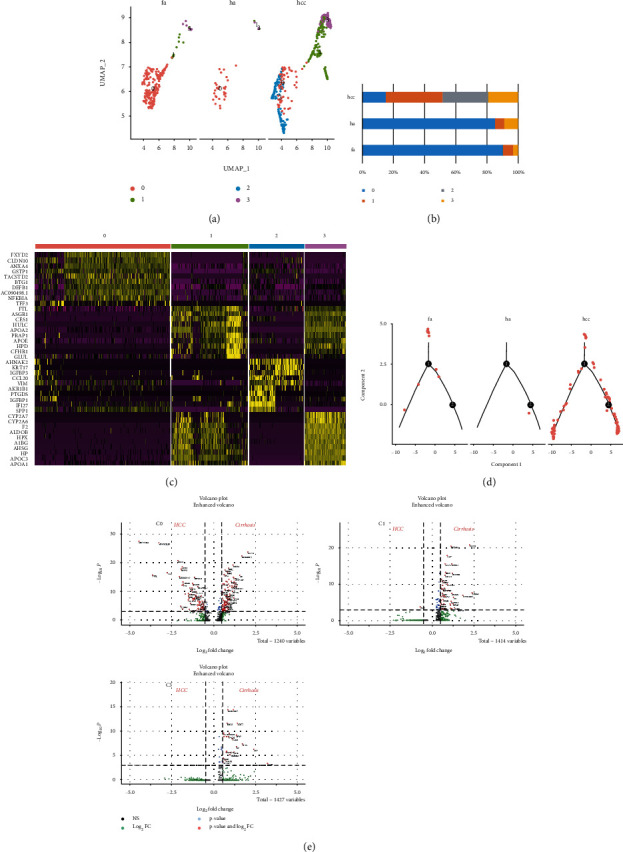
Figure 3.

Subcluster analysis of the epithelial cells. (a) UMAP diagram depicts 4 subtypes of the epithelial cells. (b) Bar graphs quantify and compare the proportion of epithelial cell subtypes of healthy (ha), fibrosis (fa), and HCC (hcc) patients. (c) Differential genes of 4 epithelial cell subtypes. (d) Analysis of the trajectory of cluster 1 in the healthy (ha), fibrosis (fa), and HCC (hcc) state. (e) Volcano plots show the DEGs between fibrosis and HCC in 3 epithelial cell subtypes; C2 exists only in the HCC.
