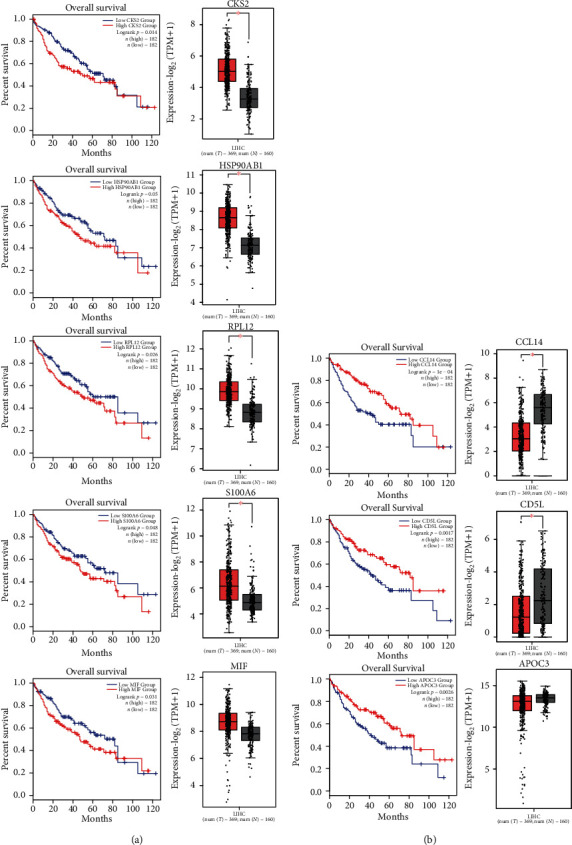
Figure 5.

Impact of the DEGs between fibrosis and HCC in the HCC patients. (a, b) Kaplan-Meier analysis of overall survival according to the gene expression in HCC patients from the TCGA dataset. The p value was calculated by the log-rank test. (a) The high expression of CKS2, HSP90AB1, RPL12, S100A6, and MIF predicts poor prognosis. Analysis of mRNA expression in HCC compared to normal liver tissue. ∗p < 0.05. (b) The low expression of CCL14, CD5L, and APOC3 predicts poor prognosis. Analysis of mRNA expression in HCC compared to normal liver tissue. ∗p < 0.05.
