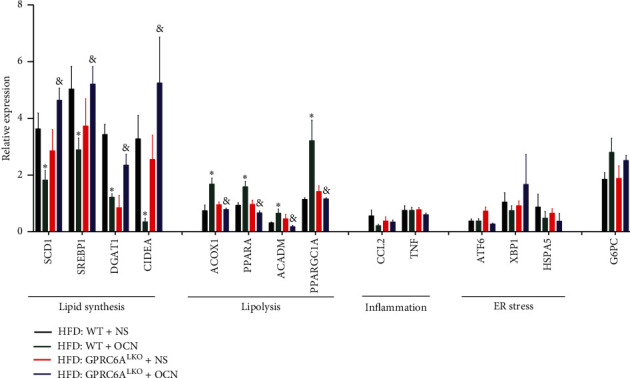
Figure 4.

Relative expression of genes involved in lipid synthesis, lipolysis, inflammation, ER stress, and gluconeogenesis. Data were expressed as the mean ± SEM and were analyzed by independent-samples T-test. ∗P < 0.05, HFD : WT + OCN compared with HFD : WT + NS; &P < 0.05, the GPRC6ALKO : HFD + OCN group compared with the WT : HFD + OCN group. ACADM, acyl-coenzyme A dehydrogenase medium chain; ACOX1, acyl-coenzyme A oxidase 1; ATF6, activating transcription factor 6; CIDEA, cell death-inducing DNA fragmentation factor alpha subunit-like effector A; CCL2, chemokine (C-C motif) ligand 2; DGAT1, diacylglycerol O-acyltransferase 1; G6PC, glucose-6-phosphatase catalytic subunit; HSPA5, heat shock protein 5; PPARGC1A, peroxisome proliferator-activated receptor gamma coactivator 1 alpha; PPARA, peroxisome proliferator-activated receptor alpha; SCD1, stearoyl-coenzyme A desaturase 1; SREBP1, sterol regulatory element binding transcription factor 1; TNF, tumor necrosis factor; XBP1, X-box binding protein 1.
