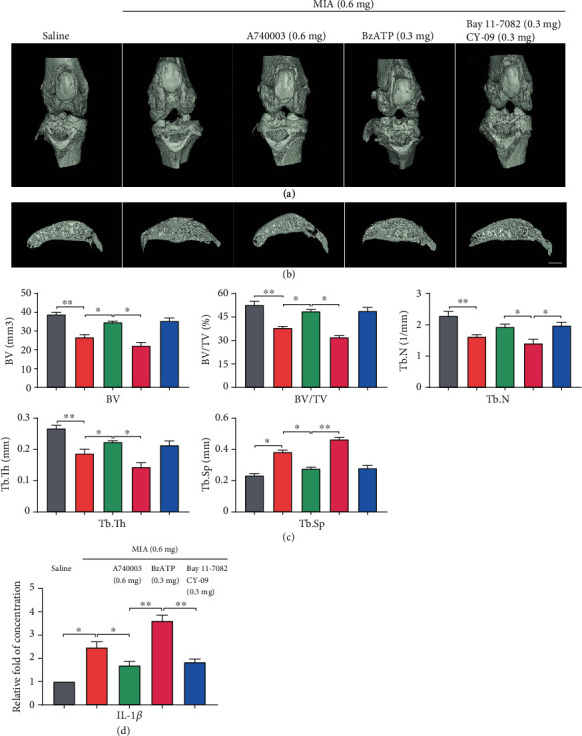
Figure 6.

MIA-induced OA evaluated by micro-CT. (a) Frontal views of the knee joints 4 weeks after MIA injection, represented as three-dimensional micro-CT images. (b) Sagittal views of medial compartment subchondral bone. (c) Quantification of bone morphological parameters (BV, BV/TV, Tb.Sp, Tb.N, and Tb.Th). (d) ELISA analysis of IL-1β in joint-cavity-lavage fluid. Data are presented as means ± SD of at least three independent experiments. ∗p < 0.05, ∗∗p < 0.01. Scale = 1 mm.
