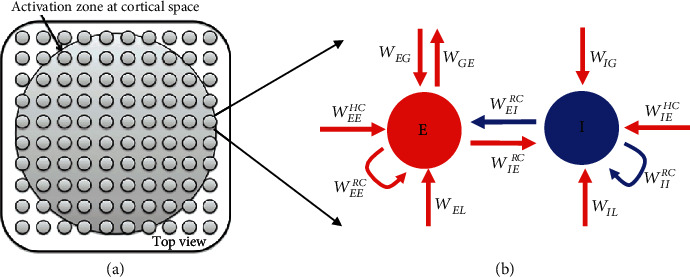
Figure 1.

The network architecture of a large scale network model. Small grey circular patches in (a) represent 15 by 15 local components in the network. These local components are placed horizontally on a plane parallel to cortical surface which mimic hypercolumns in V1. The spatial range of activation zone, or the number of activated E-I units in the model, is dependent on the size of external visual stimulus. Each local component in (b) consists of excitatory (E) and inhibitory (I) component connected with local connection WEERC, WEIRC, WIERC, and WIIRC. In the cortical space, the E and I components receive feedforward input (WEL, WIL) from subcortical regions (LGN) that are driven by visual stimuli, horizontal inputs (WEEHC and WIEHC) from other E-I units and receives feedback (WEG, WIG) from higher visual cortex (G). The higher visual cortex (G) receives feedforward (WGE) input from V1 as well.
