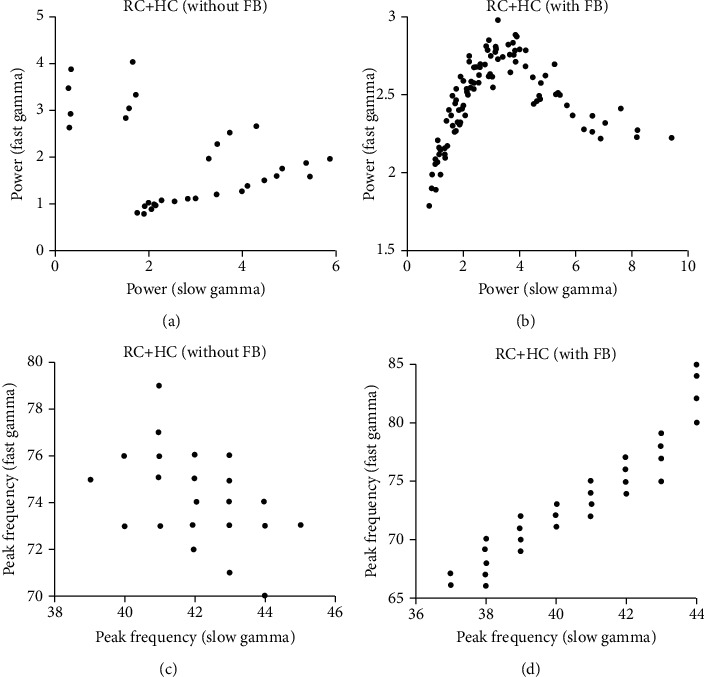
Figure 5.

Relationship between gamma oscillations in the HC network without and with FB. (a) shows the scatter plot of peak power for slow (x-axis) and fast gamma (y-axis) in the network without FB. (b) shows the scatter plot of peak power for slow (x-axis) and fast gamma (y-axis) in the network with FB. (c) shows the scatter plot of peak frequency for slow (x-axis) and fast gamma (y-axis) in the network without FB. (d) shows the scatter plot of peak frequency for slow (x-axis) and fast gamma (y-axis) in the network with FB. The data points for (a) and (c) are peak powers and frequencies in different weights of HC, and for (b) and (d) are that in different weights of FB.
