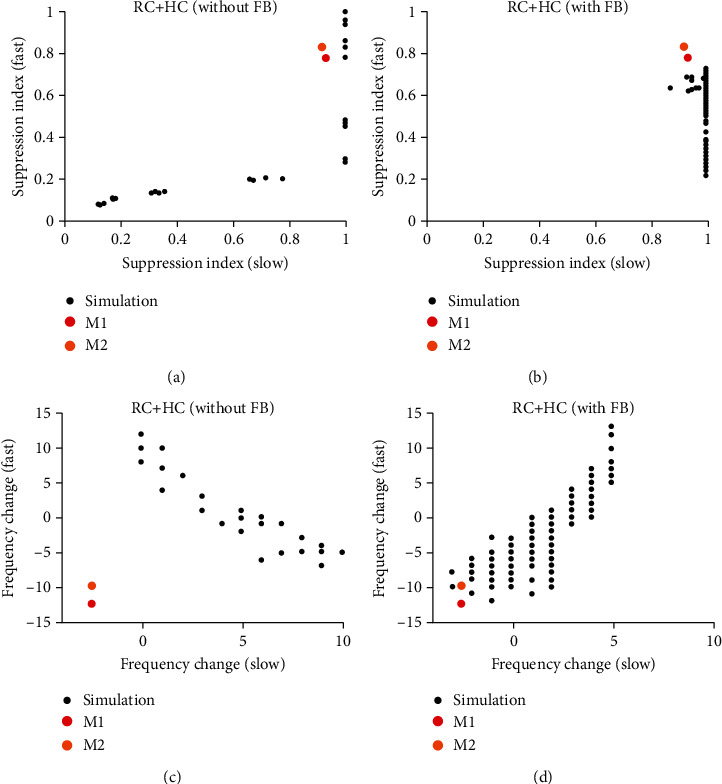
Figure 8.

Gamma oscillations in V1 require both HC and FB. (a) shows the scatter plot of suppression index for slow (x-axis) and fast gamma (y-axis) in the network without FB. (b) shows the scatter plot of suppression index for slow (x-axis) and fast gamma (y-axis) in the network with FB. (c) shows the scatter plot of frequency change for slow (x-axis) and fast gamma (y-axis) in the network without FB. (d) shows the scatter plot of frequency change for slow (x-axis) and fast gamma (y-axis) in the network with FB.
