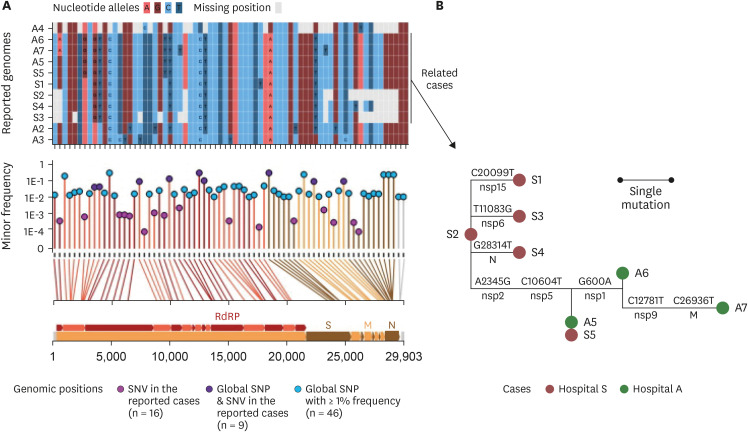
Fig. 2. SNVs among the genomes reconstructed from eleven RNA samples. (A) Allele states of the eleven genomes at the SNV sites and global SNP sites. The upper panel outlined the allele states of the 11 genomes at the 71 positions that had either SNVs from the cases in this study or from GISAID sequences. The lower panel described the minor allele frequency of the 71 SNV/SNP positions. The vertical lines connecting the allele frequency point to the bottom x-axis were colored according to the color of the genomic feature in the genomic map that was inserted in the bottom of the figure. The genomic coordinates of each of the 71 positions were mapped by line to the genomic map at the bottom. RdRp, S, M, and N stood for regions encoding the RNA-dependent RNA polymerase, the spike protein, the membrane protein, and the nucleocapsid, respectively. (B) Reconstructed mutation events among the eight epidemiologically related cases. The SNVs were phylogenetically analyzed using the maximum-likelihood tree method. Mutations on the branches were defined based on ancestral reconstruction of the allele states. Labels above the branches denoted the nucleotide changes at a given genomic coordinate; those below the branches denoted the protein-level regions where the mutated loci resided.
SNV = single nucleotide variant, SNP = single nucleotide polymorphism, nsp = nonstructural protein, N = nucleocapsid protein, M = membrane protein.

