
Figure 2.
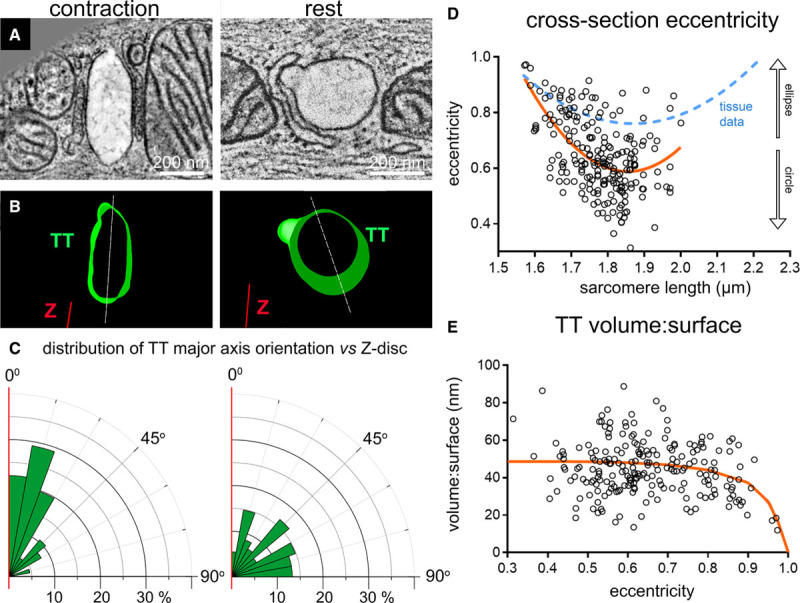
Shape and orientation of transverse tubules (TT) change during dynamic (milliseconds) cardiomyocyte contraction and relaxation (high-pressure freezing [HPF]-preserved beating cells). A, Representative electron tomography (ET) slices from single cardiomyocytes, HPF-preserved at prescribed intervals after electrical stimulation, here at rest before contraction (sarcomere length [SL]=1.78 µm) and during peak contraction (SL=1.57 µm, HPF timed at 105 ms post-stimulation). B, Segmented 3-dimensional TT models based on ET volumes. C, Rose plots of the distribution of minimum angle α between TT cross-sectional major axis and Z-disc plane in the 2 mechanical states. Statistical significance was assessed comparing a mixed effects model to a constant model (Online Figure IIB, data assessed using linear regression model); P<0.0001. D, TT cross-section eccentricity as a function of SL. Data were assessed using nonlinear quadratic fit (orange curve). Statistical significance was assessed comparing a mixed effects model to a constant model (see also Online Figure IIC); P<0.0001. Blue dashed curve shows the equivalent relationship observed for tissue data (from Figure 1D). E, Volume-to-surface ratio of TT segments as a function of TT cross-sectional eccentricity. Data fitted with a realistic geometric shape-based model, assuming an elliptical cross-section with constant circumference and volume:surface value of 0 at ε=1 (orange curve, see also Online Figure III). Statistical significance was assessed comparing a mixed effects model to a constant model (linear fit, not shown; see also Online Figure IID); P<0.05. N=2 hearts/16 tissue samples/56 cells/214 TT (see also Online Table II). P values indicate whether a fitted model is more suitable than assuming a constant relationship.