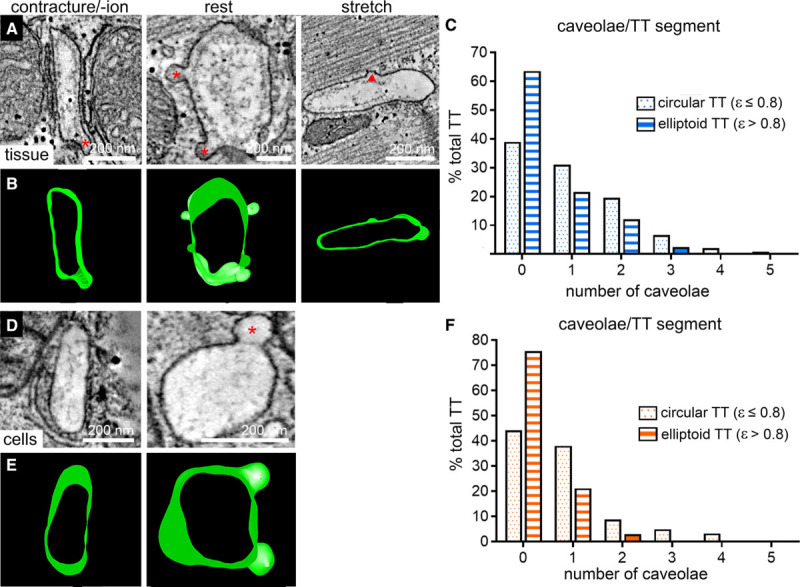
Figure 5.

Presence of caveolae is inversely related to transverse tubule (TT) eccentricity during static (chemically fixed tissue) and dynamic (high-pressure freezing-preserved cells) changes in sarcomere length. A and B, Representative electron tomography (ET) slices and segmented 3-dimensional models demonstrating the presence of TT caveolae in tissue preserved at contracture, rest, or stretch (red stars indicate caveolae; red triangle marks site of presumed partial membrane integration of caveolae). C, Frequency distribution histograms of the number of caveolae observed in TT segments (250 nm length) with cross-sectional eccentricity ε≤0.8 (dotted blue bars, n=241 TT) and ε>0.8 (striped blue bars, n=298 TT) in tissue, N=7 hearts/29 tissue samples/125 cells, see also Online Figure VI and Online Table I. D and E, Representative ET slices and segmented models demonstrating the presence of TT caveolae in cells preserved during contraction or at rest (red star indicates caveolae). F, Frequency distribution histograms of the number of caveolae observed in TT segments (250 nm length) with cross-sectional eccentricity of ε≤0.8 (dotted orange bars, n=181 TT) and ε>0.8 (striped orange bars, n=33 TT) in cells, N=2 hearts/16 tissue samples/56 cells, see also Online Figure VI and Online Table II.
