Figure 6.

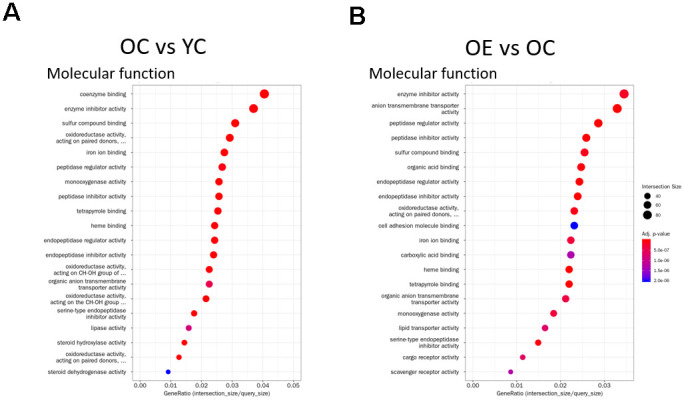
Gene Ontology Enrichment analysis. (A, B) Enrichment results for the top 20 GO terms in (A) OC vs YC and (B) OE vs OC that satisfy adjusted p-value < 0.05 for each GO category are plotted. Dot size indicates Gene Ratio.

Gene Ontology Enrichment analysis. (A, B) Enrichment results for the top 20 GO terms in (A) OC vs YC and (B) OE vs OC that satisfy adjusted p-value < 0.05 for each GO category are plotted. Dot size indicates Gene Ratio.