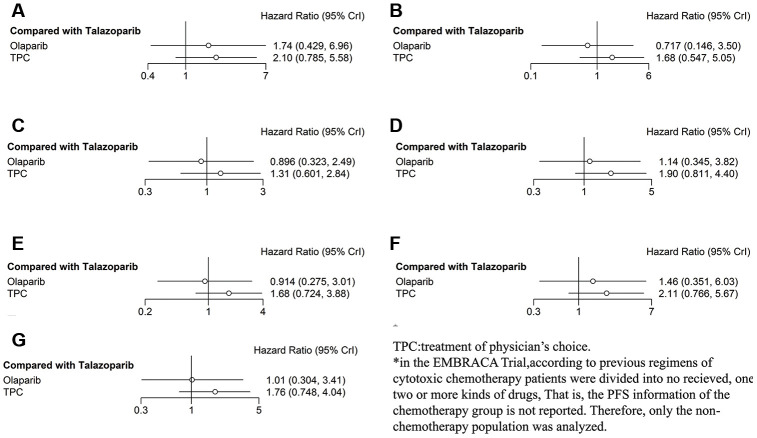
Figure 4.
Forest plots comparing PFS for talazoparib, olaparib, and TPC (subgroup analysis). (A) Hormone receptor–positive patients; (B) patients with TNBC; (C) patients with prior platinum; (D) patients with no prior platinum; (E) patients with BRCA1 mutation; (F) patients with BRCA2 mutation; (G) patients who received no prior chemotherapy.

