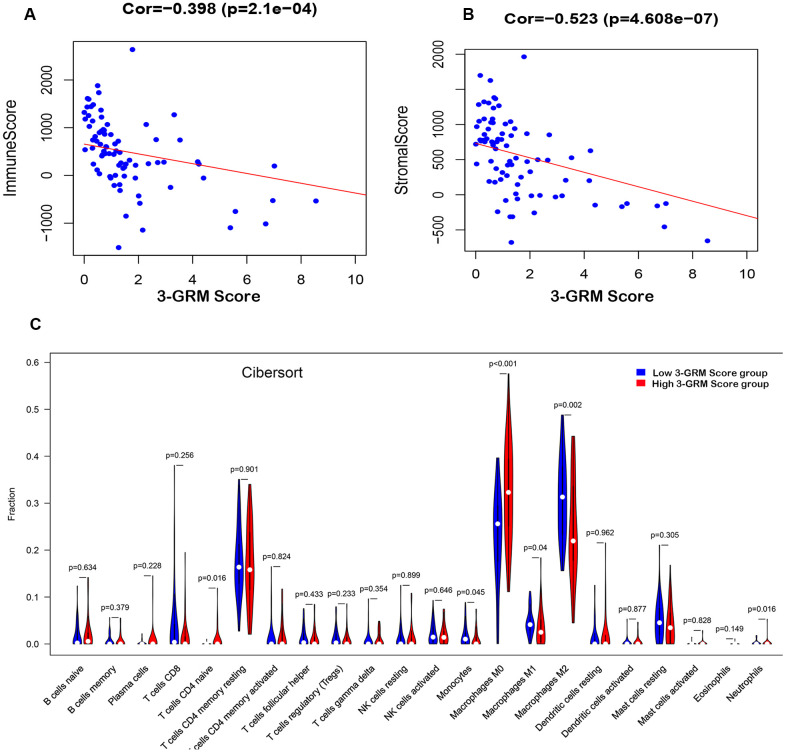
Figure 8.
Relationship between the 3-GRM score and the immune/stromal score, and the level of TIICs. (A) The relationship between the 3-GRM score and the immune score by Estimate. (B) The relationship between the 3-GRM score and the stromal score. (C) Comparison of the levels of TIICs between high 3-GRM score group and low 3-GRM score group by Cibersort. The horizontal axis represents the type of TIICs, and the vertical axis represents the relative percentage. NS, no significance; TIICs, tumour-infiltrating immune cells.

