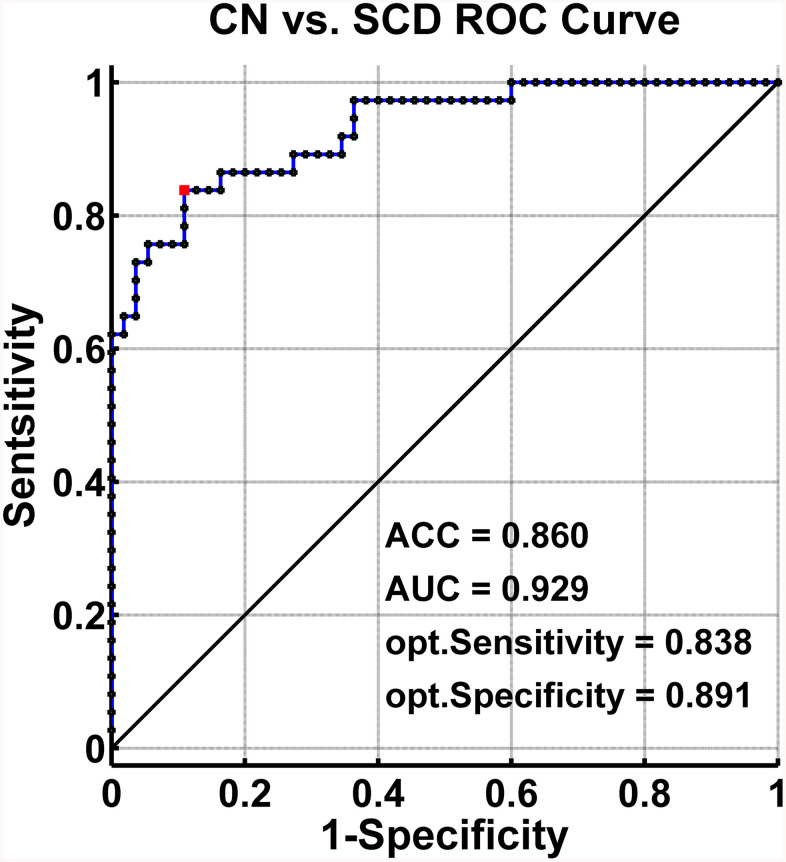
Figure 5.
Classification of individuals as SCD versus CN by MRI-based “classifier”. The ROC curves hows the classification power in MRI-based “classifier” of SCD from CN. Note: the values of ACC, AUC, sensitivity, and specificity in lower right of the figure present the optimum values under the optimum combined index score (red point). Abbreviations: SCD, subjective cognitive decline; CN, healthy controls; AUC, area under the ROC curve; ACC, accuracy; Opt, optimum; ROC, receiver operating characteristic; MRI, magnetic resonance imaging.

