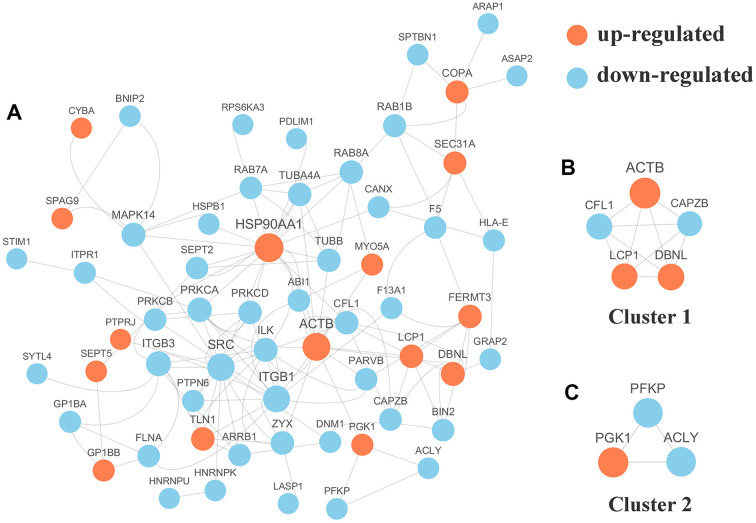
Figure 5.
(A) Protein-protein interaction (PPI) network analyses of differentially expressed phosphorylated proteins (DPPs) were performed and 2 significant clusters were yielded by molecular complex detection (MCODE) algorithm. Red and light cyan indicate up- and down-regulated DPPs, respectively. Yellow indicates hub phosphorylated proteins based on degree. (B) Cluster 1 (MCODE score = 5.000) was constructed with 5 nodes and 10 edges. (C) Cluster 2 (MCODE score =3.000) was constructed with 3 nodes and 3 edges.

