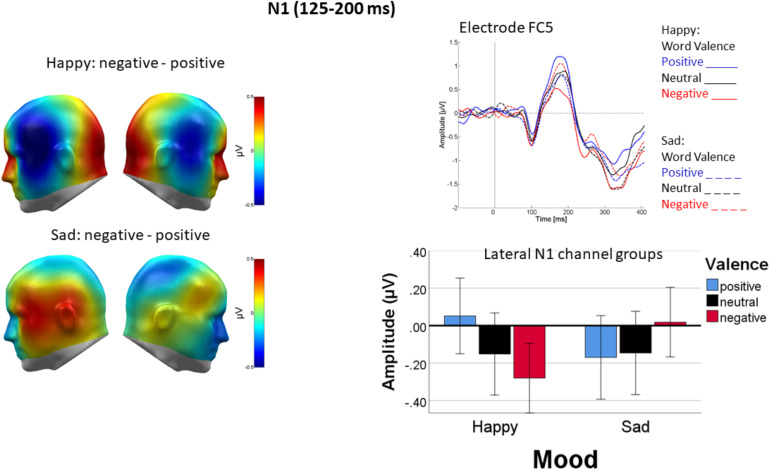
FIGURE 4.
Differential processing of negative versus positive words over temporal cortices following happy but not sad mood induction. Left panel: Difference topographies of average activity in the N1 time window (125–200 ms). Right panel: Representative sensor FC5 (top) and bar plot showing mean activity averaged across both temporal sensor groups. Error bars are standard errors.

