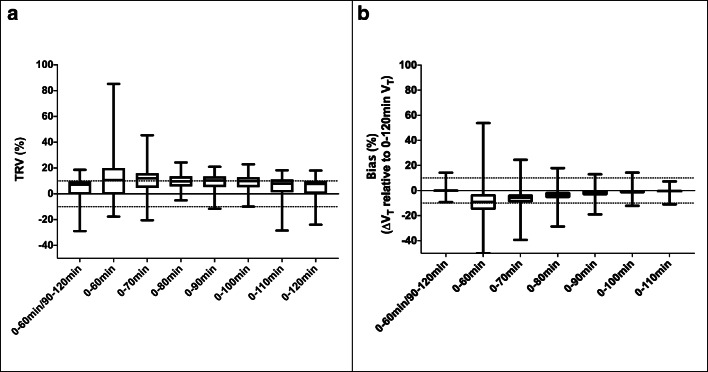
Fig. 6.
Graphical representation of the time stability of Logan graphical analysis (LGA) VT for a coffee-break protocol (0–60/90–120 min) and reduced acquisition times (0–[60–120] min) compared to a 120-min dynamic acquisition protocol. Test-retest variability (TRV) defined as for test-retest datasets (4 subjects, 2M/2F, cohort B) with dotted lines corresponding to ± 10% TRV (a) and bias defined as the relative difference between LGA VT values using a reduced and 120-min scan time (n = 12 subjects, 6M/6F, cohorts B–C, only the first scan was considered for subject with 2 scans) with dotted lines corresponding to ± 10% bias (b)

