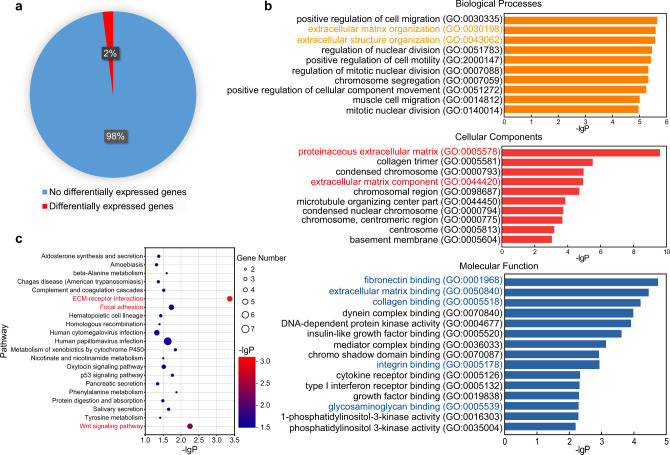
Fig. 3. RNA-seq analysis on DM50CO50-modified surface compared to RGD-modified surface.
a From 17,267 gene transcripts in analysis, 305 differentially expressed genes showed greater than 50% change in expression level after 2 days of culture. b Significant GO terms of associated biological processes, cellular components, and molecular functions from differentially regulated genes. c KEGG pathway enrichment. The y-axis label represents KEGG pathway, and the x-axis shows -lgP. The size of the dots represents the number of gene enrichment.

