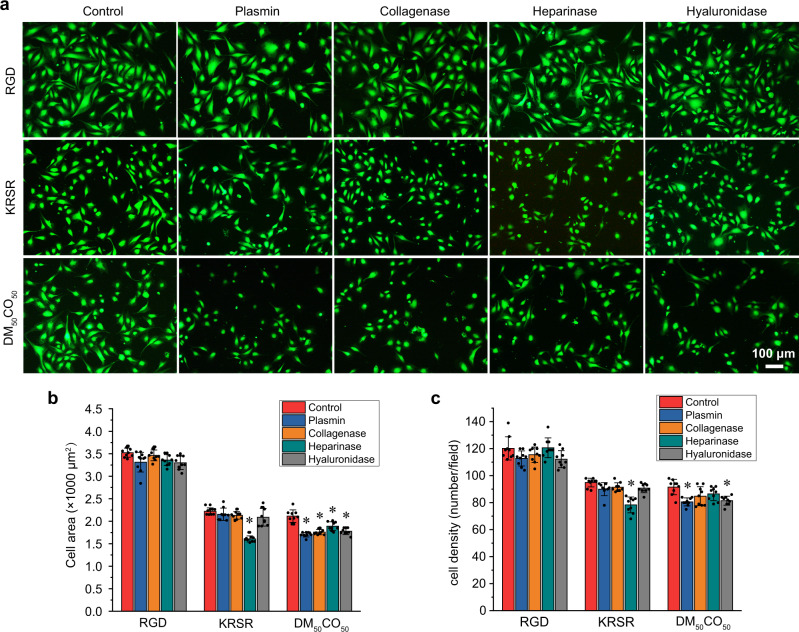
Fig. 6. Effect of membrane proteins and polysaccharides on preosteoblast cell adhesion.
Fluorescent micrographs of: a live/dead stained cells, b spreading area, and c density analysis, of cells adhered to RGD, KRSR, and DM50CO50-modified surfaces for 1 day in a serum-free medium. Cells were treated with plasmin, collagenase, heparinase, and hyaluronidase, respectively, before seeded on the surfaces. Untreated cells were used as the control. Data in (b, c) represent mean ± s.d. (n = 9). Statistical analysis: one-way ANOVA with Tukey post-test, *p < 0.01.

