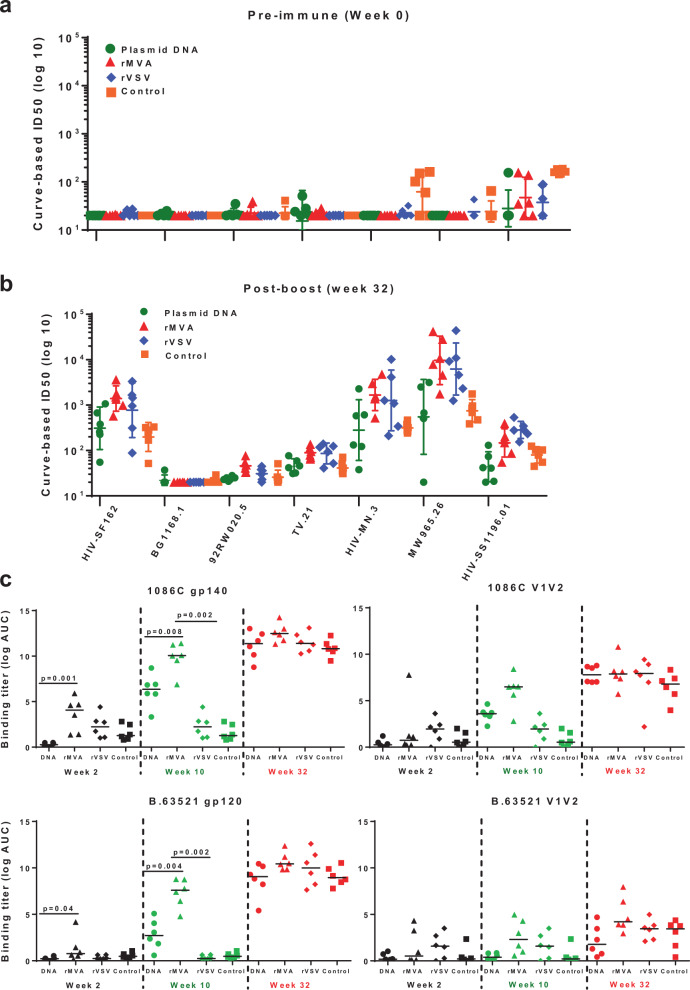
Fig. 1. Antibody responses elicited by different priming immunizations.
Neutralizing antibody responses as measured by TZM-bl cell-based assay at pre-immune, week 0 (a) and post-boost, week 32 (b) time points. TZM-bl cell-based neutralization assays were performed against both Tier 1 and Tier 2 viruses. Curve-based log ID50 values for pre-immunization and post-protein boost time points are shown for plasmid DNA (green circles), rMVA (red triangles), and rVSV (lavender diamonds), and protein only control (orange squares) groups. ID50 titers against seven different viruses, HIV-1 SF162, BG1168.1, 92RW020.5, TV.21, HIV-MN.3, MW965.26, and HIV-SS1196.01 are shown with geometric mean with 95% CI of the six monkeys per group. c Binding antibody titers elicited by different priming immunizations. ELISA binding titers (log AUC) of plasma against autologous (upper panels) and heterologous (lower panels) antigens from individual monkeys in four vaccine groups are shown at Week 2 (black symbols), Week 10 (green symbols), and post-boost (red symbols) time points. The lines indicate the median of the six monkeys per group.

