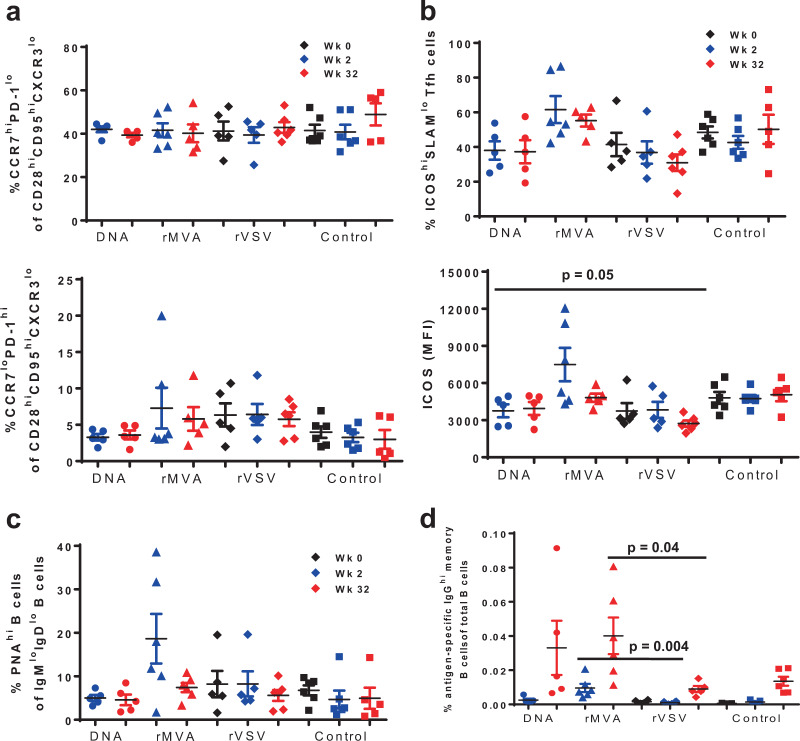
Fig. 4. Increased expression of ICOS on Tfh CD4+ T cells is associated with induction of Env-specific B-cell responses after priming with rMVA.
In each panel, black symbols denote pre-immunization (Week 0), blue symbols post-prime (Week 2) and red symbols show post-boost measurements. Plasmid DNA group is represented by using circles, rMVA by triangles, rVSV by diamonds, and control group by squares. Bars depict SEM. a Both upper and lower panel show the percentages of Tfh CD4+ T cells based on the expression of CCR7 and PD-1 in lymph node-derived lymphocytes. b Upper panel shows the percentages of ICOShiSLAMlo Tfh CD4+ T cells for individual monkeys from each vaccine group at weeks 0, 2, and 32. Lower panel shows the expression of ICOS per Tfh CD4+ T cell—based on Mean Fluorescence Intensity (MFI). c Dot plots showing accumulated data of relative frequencies (%) of bulk germinal center memory B cells in lymph node (LN) tissues at the indicated time points as judged by PNA staining—memory B cells in LN tissues obtained at the indicated time points. d Immunogen-specific B cells responses were detected by using a specific Env probe in bulk memory B cells from LN tissues. The relative frequencies are shown as a percentage of total B cells. All LN samples were analyzed in one experiment. Non-parametric Mann–Whitney U test was used for the statistical analysis and mean and SEM are shown for each vaccine group.

