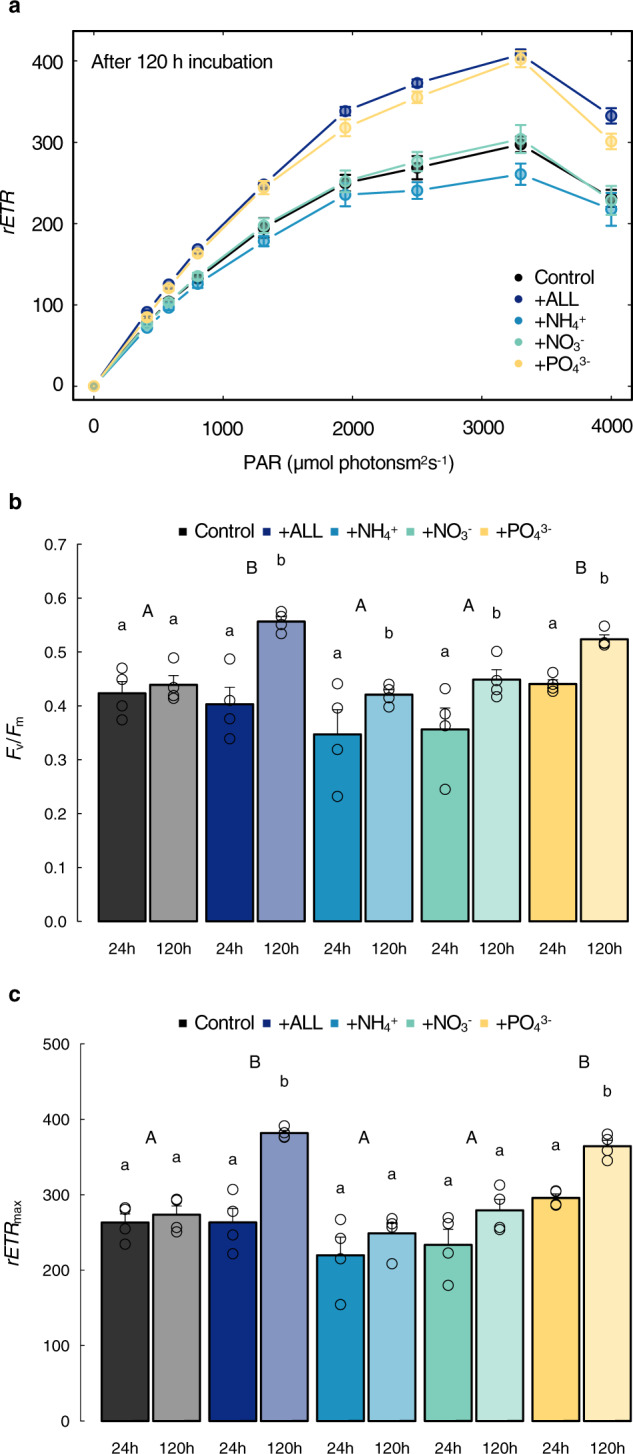
Fig. 2. Glacier algal photophysiological response to nutrient addition.

a Relative electron transport rates (rETR) measured during rapid light curves (RLCs) following 120 h incubation, b maximum quantum efficiency in the dark-adapted state (Fv/Fm) and c maximum electron transport rate (rETRmax) after 24 and 120 h incubation. All plots show mean ±SE, n = 4. b, c lower and upper case letters denote homogeneous subsets identified from two-way ANOVA analysis of respective parameters in relation to duration and nutrient treatment, respectively. Two-way ANOVA results comparing treatments: F4,30 = 6.48, P = 0.000699, and time points (24 vs 120 h): F4,30 = 28.75, P = 0.00000839 for Fv/Fm. Two-way ANOVA results comparing treatments: F4,30 = 16.71, P = 0.000000264, and time points: F4,30 = 35.07, P = 0.00000174 for rETRmax. The results of Tukey HSD tests comparing Fv/Fm and rETRmax results for treatments at 24 and 120 h can be found in Supplementary Tables 2 and 3.
