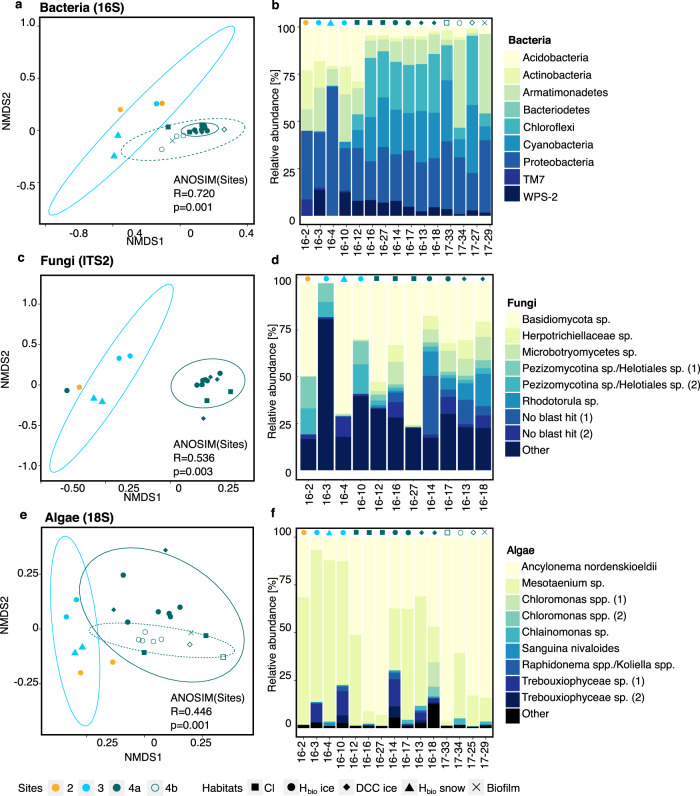
Fig. 4. Composition of bacterial, fungal, and algal communities in surface habitats across the Dark Zone.
NMDS plots showing the sample similarities for bacteria (a), fungi (c), and algae (e) and their respective community compositions based on relative abundances (b, d, f). Sites are represented by colors and habitats by point shapes. Samples cluster according to sites and dashed lines represent the 95% confidence interval. All samples with a sufficiently high number of sequences were used for the NMDS plots, whereas representative samples across sites and habitats were selected for the bar charts (details in Supplementary Tables 9–13).

