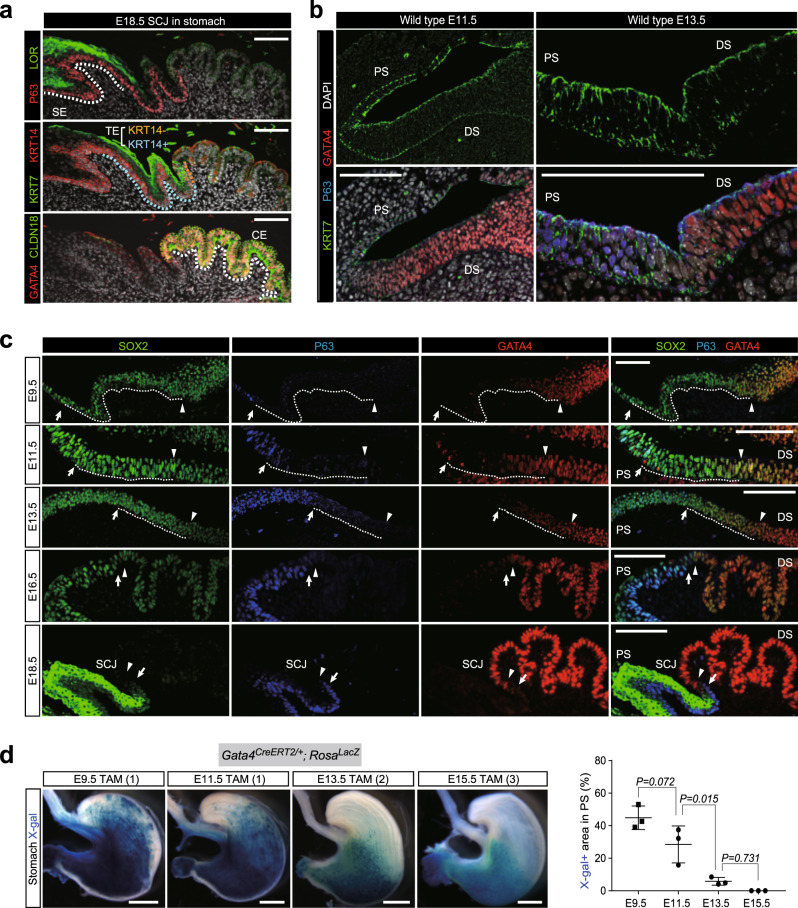
Fig. 1. Expression patterning of SOX2 and GATA4 in the stomach epithelium during SCJ development.
a Immunofluorescence (IF) analyses of P63 and LOR (top), KRT7 and KRT14 (middle), or GATA4 and CLDN18 (bottom) for the SCJs of wild-type stomachs at E18.5. All samples were counterstained with DAPI. SE squamous epithelium, TE transitional epithelium, CE columnar epithelium. Presented data are a representative image of n = 5. Scale bar, 100 µm. b IF analyses of KRT7, P63, and GATA4 for wild-type stomachs at E11.5 and E13.5. PS proximal stomach epithelium, DS distal stomach epithelium. Presented data are a representative image of n = 5. Scale bar, 100 µm. c IF analyses of SOX2, P63, and GATA4 for wild-type stomachs at E9.5, E11.5, E13.5, E16.5, and E18.5. Arrows indicate the P63+ cells on the epithelium at the most caudal side. Arrowheads indicate GATA4+ epithelial cells at the most rostral side. Dashed lines indicate the intermediate epithelial cells with low expression of both P63 and GATA4. Presented data are a representative image of n = 4. Scale bar, 100 µm. d Left: whole-mount X-gal staining on the stomach of the Gata4CreERT2/+; RosalacZ embryos. Presented data are a representative image of n > 8 embryos out of three independent experiments. Scale bars, 1 mm. Right: quantification of the X-gal+ area in the proximal stomach. Data are presented as mean values ± SD. n = 3 independent experiments, one-way ANOVA.

