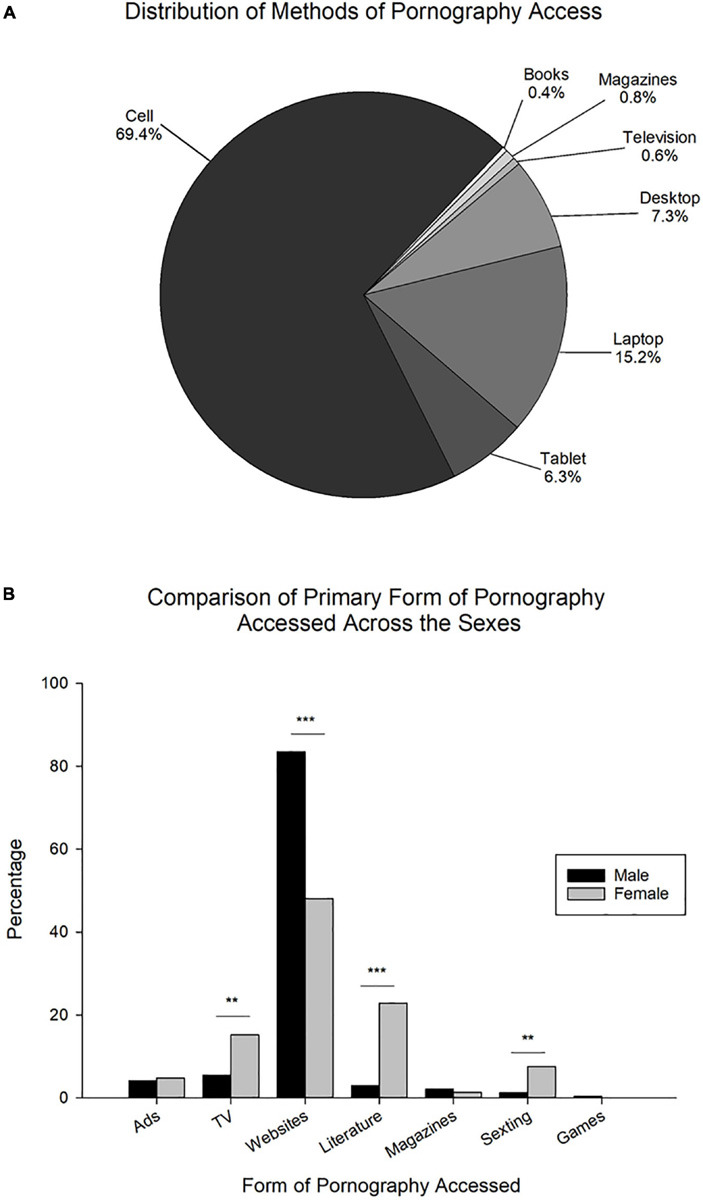
FIGURE 2.

Details of pornography use during period of most frequent use. (A) Distribution of methods of pornography use. Given that no significant differences were observed between the sexes, data is shown as a percentage of males and females combined indicating specific method of access. Cell, cell phone; Books, physical (paper) books; Magazines, magazines; Television, television; Desktop, desktop computer; Laptop, laptop computer; Tablet, tablets (e.g., Kindle, iPad, etc.) (N = 488). (B) Comparison of the primary form of pornography accessed during period of most frequent use across the sexes (N = 488; Male: n = 254; Female: n = 234). Ads, advertisements on the internet; TV, TV/Movies; Websites, adult websites (e.g., pornography websites); Literature, Adult/Erotic literature; Magazines, pornographic magazines, Sexting, sexting/phone sex/hotlines/Snapchat, Games, adult video games. Data is expressed as percentage of participants responding to a specific answer choice. **p < 0.01, ***p < 0.001.
