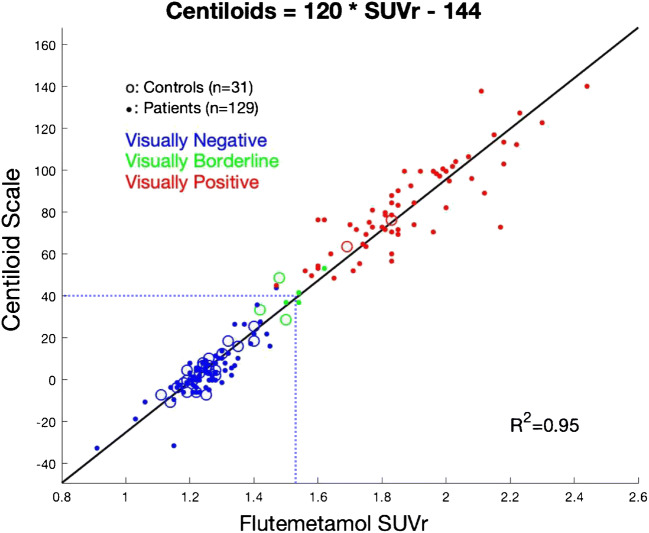
Fig. 2.
Scatterplot demonstrating the linear relationship between PET data expressed using our in-house [18F]-flutemetamol SUVr and the same PET data expressed in the Centiloid scale. Visual threshold corresponded to Centiloid = 40 (SUVr = 1.53), indicated by the blue dotted line. The direct conversion of SUVrCentiloid to Centiloid values was Centiloid = 116.0 × SUVrCentiloid − 113.9. The conversion of our in-house SUVr (using cerebellar gray as the reference region) to Centiloid values was: Centiloid = 120.2 × SUVrin-house − 144.5

