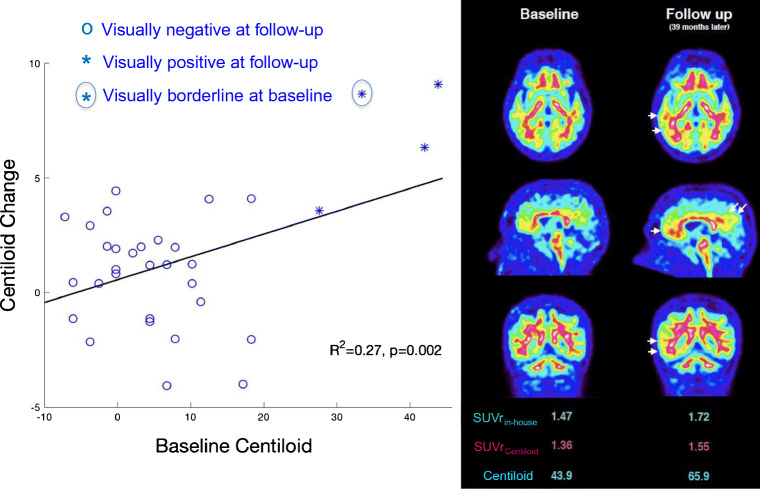
Fig. 5.
Baseline Aβ-PET predicts subsequent change in PET data, driven by individuals with positive quantitation at baseline. Left: fast accumulation (> 5 Centiloids per year) was only observed in participants with Centiloid ≥ 26 at baseline. Note that no patients had a baseline Centiloid between 20 and 25. All participants but one (borderline) had a visually negative baseline PET, although four participants (designated with ×) had positive quantitation (Centiloid between 27.6 and 43.9). Right: illustrative PET images of a participant who demonstrated increased Aβ-PET signal during follow-up

