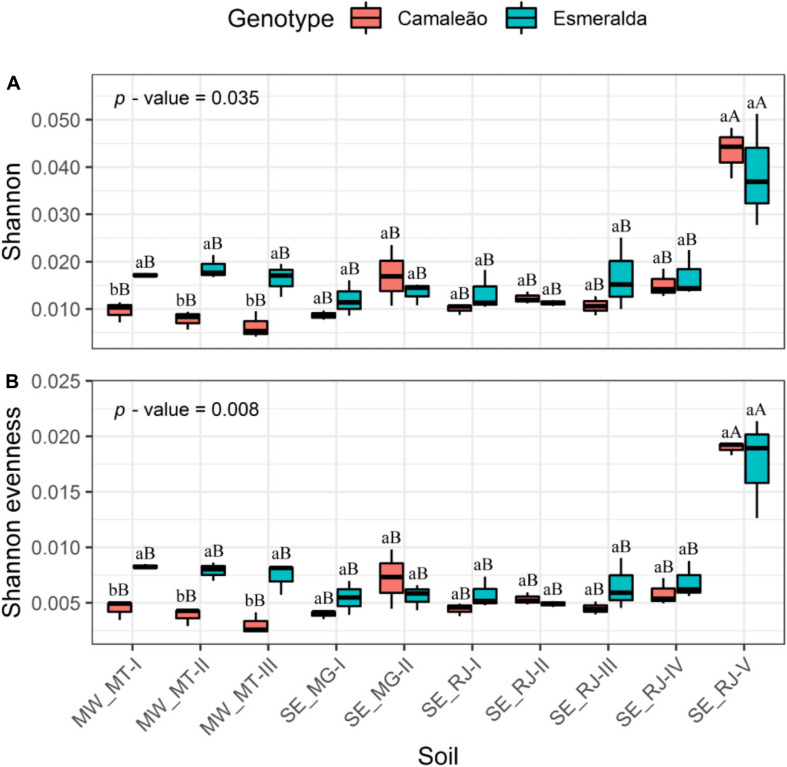
FIGURE 4.
(A) Shannon’s diversity and (B) evenness of bacterial communities from nodules of Camaleão and Esmeralda mung bean genotypes inoculated with 10 different soils. p-values are based on anava. Distinctive letters, lowercase between genotypes and uppercase between soils, indicate statistical difference by the Scott–Knott test at 5% probability.

