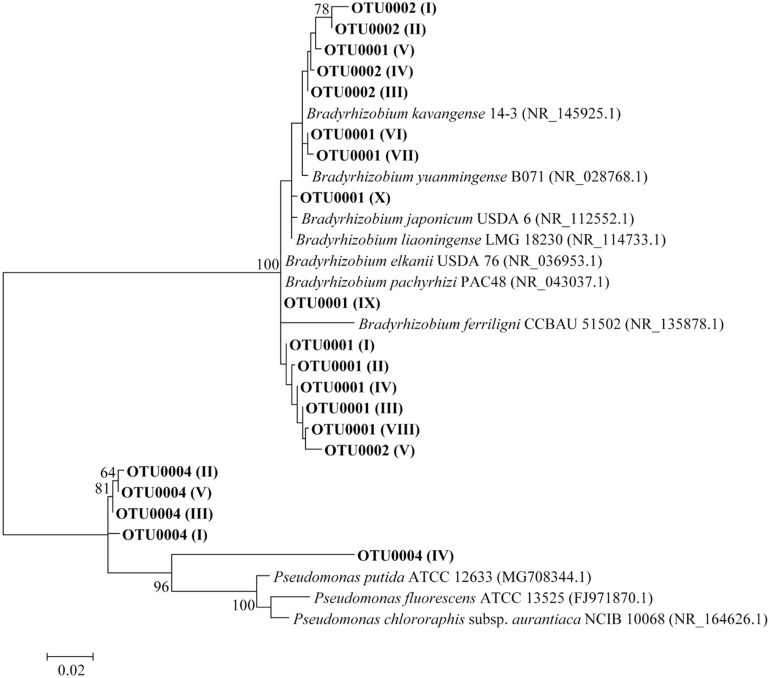
FIGURE 8.
Maximum likelihood phylogenetic tree for OTUs classified, based on 16S rRNA gene sequences. Tree estimated through 441 base pair positions. The 10 most abundant sequences from OTU0001 and five from OTU0002 and OTU0004 were used. Letters in Roman numerals indicate order of abundance of the strings within their respective OTUs. Bootstrap values are shown when the relationships represented have been observed in at least 50% of 1,000 replicates. The tree was obtained using the Kimura 2-parameter + G model.

