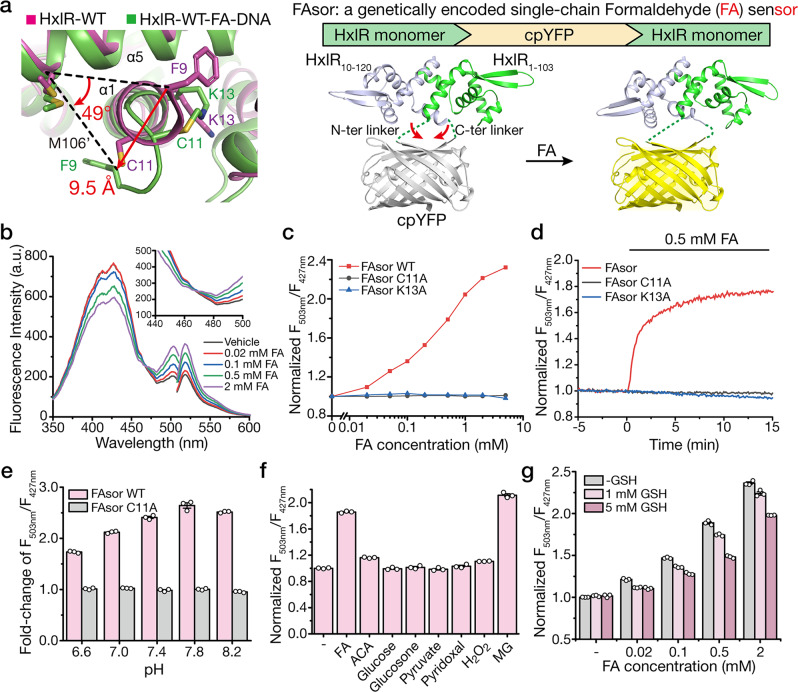
Fig. 3. Development and characterization of the HxlR-based FA sensors (FAsors).
a Structure-guided design of the genetically encoded FA sensor—FAsor for detecting conformational change in HxlR protein. FA-triggered Cys11-Lys13 crosslinking induces large translocation of residue Phe9 on the same helix (9.5 Å and turned 49 degree to Met106’ on helix α5). By fusion of a cpFP between two subunits in HxlR dimer protein, the resulting single-chain sensor (HxlR-cpYFP-HxlR) can transduce the FA-induced conformational change into the fluorescence signal change. Red arrows indicate distance of Phe9 translocation during conformational change. b Fluorescence response of FAsor in the presence of FA. Excitation and emission spectra of FAsor in the absence and presence of different concentrations of FA are shown. FAsor exhibited a ratiometric property in its excitation spectrum, with its fluorescence increased above 467 nm and decreased below 467 nm upon FA treatment. c The ratiometric change of FAsor in response to serial concentrations of FA ranging from 0 to 5 mM in 30 min. The ratio is calculated as the fluorescence intensity of 503-nm excitation peak divided by that of the 427-nm excitation peak, with the emission filter fixed at 516 nm. FAsor-WT responded to FA quantitatively while FAsor-C11A and FAsor-K13A mutants remained unchanged. d Kinetics measurement of FAsor in response to FA. 0.5 mM FA was added to 10 μM FAsor. Fluorescence ratio of FAsor-WT increase rapidly upon addition of FA, while FAsor-C11A and FAsor-K13A mutants remain stable. e Response of FAsor-WT/C11A to FA at different pH. The columns indicate fluorescence change of FAsor-WT/C11A before and after addition of 2 mM FA in buffers with different pH. FAsor-WT is able to sense FA between pH 6.6–8.2 with the FAsor-C11A control probe showing negligible responses in the same pH range. f Fluorescence response of FAsor to biologically relevant carbonyl metabolites and hydrogen peroxide. Data shown are for 0.5 mM of all species. g The effects of GSH on FAsor. The fluorescent response of FAsor to FA retains up to ~80% in the presence of 5 mM GSH. Data in e–g are shown in mean ± SEM for three measurements.

