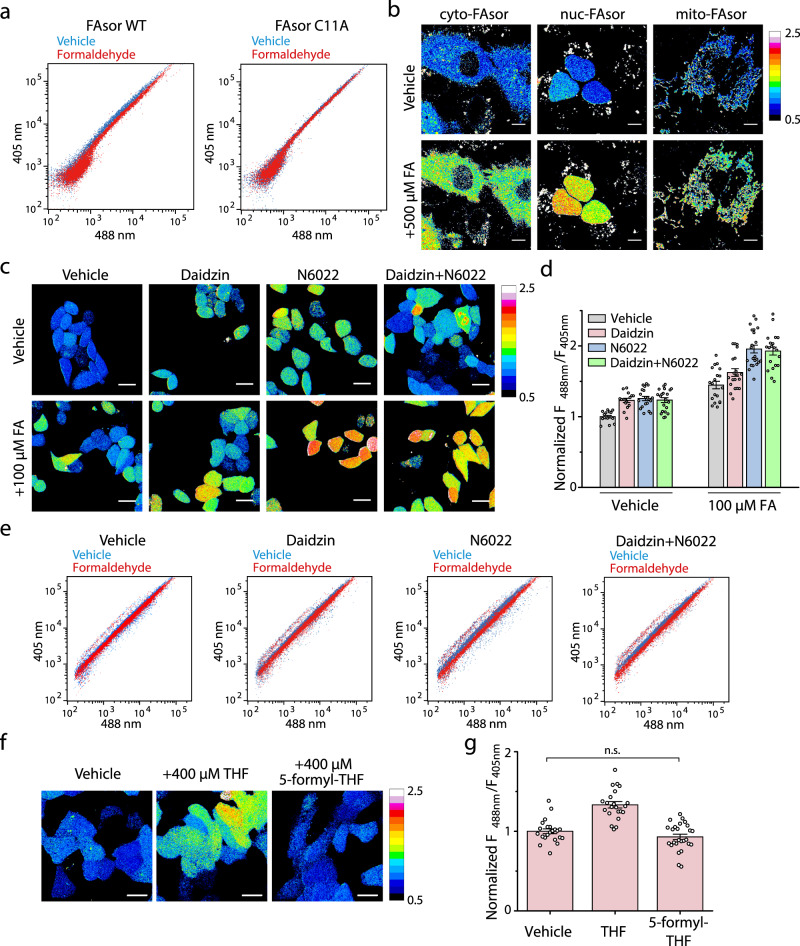
Fig. 4. Spatial and temporal visualization of FA by FAsors in living cells.
a FACS measurements of FAsor’s F488nm/F405nm ratio in response to exogenous FA in HEK293T cells. Cells are incubated at 37 °C with 0.5 mM FA for 1 h. FA induced the increase of F488nm/F405nm ratio for cells expressing FAsor-WT but not cells expressing FAsor-C11A. b Fluorescence imaging of subcellular-targeted FAsor upon the treatment of FA. HeLa cells were treated with 0.5 mM FA for 30 min. FA levels in cytosol, nucleus or mitochondria all undergo changes in response to exogenously added FA. Scale bars, 10 μm. c, d Fluorescence imaging of FAsor without subcellular-targeting sequence in response to endogenous and exogenous FA in different states of FA metabolism. HeLa cells were treated with or without the inhibitors daidzin and/or N6022 for FA-degrading enzymes for 3 h, followed with incubation with or without 0.1 mM FA for 1 h. The enhanced F488nm/F405nm ratio on inhibitor-treated cells indicates higher intracellular FA level due to the suppressed FA degradation. d is the group summary of F488nm/F405nm under different conditions. For groups from left to right, n = 16, 15, 20, 21, 19, 20, 22, and 20 cells, respectively. Scale bars, 25 μm. e FACS measurements of FAsor’s F488nm/F405nm ratio in response to FA in different states of FA metabolism. HEK293T cells are incubated with different inhibitors (10 μM each) at 37 °C for 3 h, followed with or without addition of 0.4 mM FA for another 1 h. f, g Fluorescence imaging of the FA generation via THF metabolism by FAsor without subcellular-targeting sequence. HeLa cells were treated with 0.4 mM THF or 5-formyl-THF for 30 min. The increased F488nm/F405nm ratio indicated endogenously generated FA molecules. g is the group summary of F488nm/F405nm under different conditions. For groups from left to right, n = 23, 22, and 26 cells, respectively. Unpaired two-sided student’s t-test was performed. n.s. no significance (P = 0.12). Scale bars, 20 μm. In b, c, f, images were pseudocolored with normalized F488nm/F405nm ratio. Data in d, g are shown in mean ± SEM.

