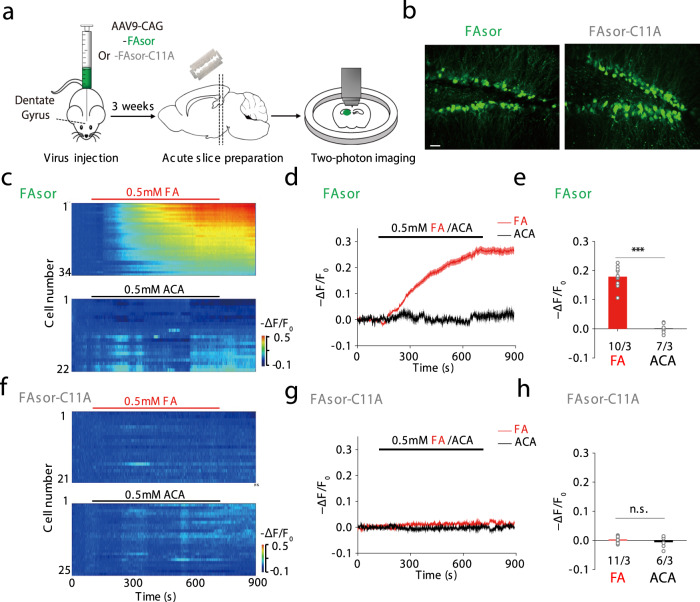
Fig. 5. Visualization of FA in mouse acute brain slices by two-photon imaging of FAsors.
a Schematic illustration of the workflow. AAVs containing FAsor or FAsor-C11A were injected into the dentate gyrus of mice, and acute brain slices were prepared 3 weeks after viral expression, which were placed under two-photon microscope for imaging. b Expression of FAsor and FAsor-C11A in pyramidal neurons of the dentate gyrus in acute brain slices. The two-photon laser was set at 880 nm for excitation. Scale bars: 20 μm. c–e The fluorescence responses of FAsor-expressing neurons to exogenous perfusion of 0.5 mM formaldehyde (FA) (upper, red), or 0.5 mM acetaldehyde (ACA, lower, black) as a control. The responses of individual cells in one single slice were plotted in pseudo-color in c, and their averaged time-dependent traces were shown in d. The group data of responses in multiple slices of different animals were summarized in e with data shown in mean ± SEM. Unpaired two-sided student’s t-test was performed. n = 10 slices from 3 mice and 7 slices from 3 mice, for FA and ACA, respectively. ***P < 0.001 (P = 3.19 × 10⁻⁷). f–h Similar as c–e, except the fluorescence responses of FAsor-C11A-expressing neurons were summarized and plotted. Data are shown in mean ± SEM in h. Unpaired two-sided student’s t-test was performed. n = 11 slices from 3 mice and 6 slices from 3 mice, for FA and ACA, respectively. n.s. no significance (P = 0.35).

