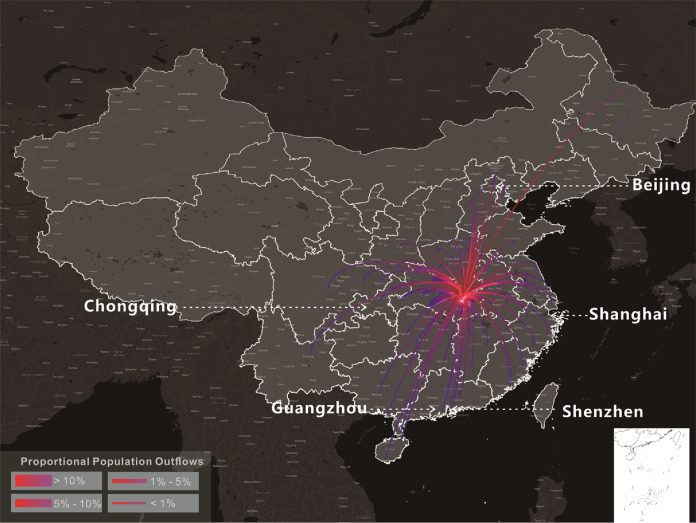
Fig. 4. The percentage outflows of migrants from Wuhan to 100 cities in China which received the largest numbers of Wuhan migrants, on 8 December 2019–23 January 2020.
The lowest percentage of Wuhan migrants received by any of the 100 cities was 0.02%. This figure is based on the massive positioning service data on the Baidu Map platform, available on https://qianxi.baidu.com/38. Several hotspot destinations of the Wuhan migrants are labelled in this figure. Lines with gradient colours represent the distance from the origin (Wuhan, shown in red) to the 100 cities.

