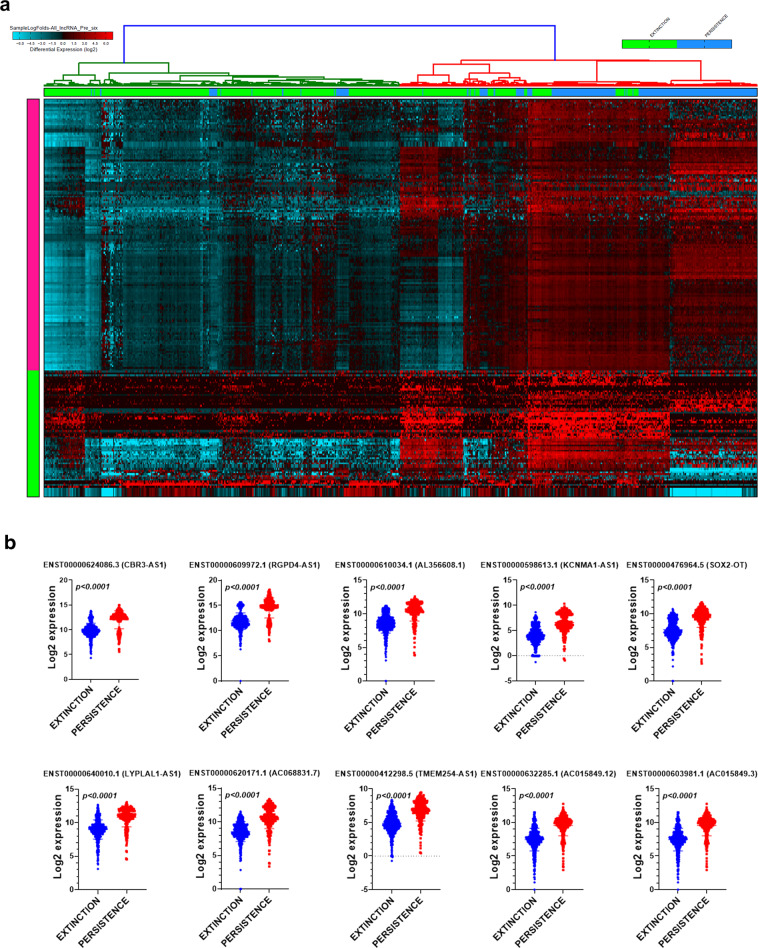
Fig. 3. Comparative analysis of the transcriptional landscape in persistence and extinction TNBC-derived single cells pre-neoadjuvant treatment.
a Hierarchical clustering of TNBC-derived single cells from persistence (n = 295) and extinction (n = 577) group prior to neoadjuvant treatment. Each column represents one cell and each row represents lncRNA transcript. The expression level of each transcript (log2) in a single cell is depicted according to the color scale. b Validation of selected number of upregulated lncRNA transcripts in a second cohort of 580 and 297 single cells derived from extinction and persistence TNBC patients, respectively. Data are presented as scatter plots with p values indicated on each plot (two-tailed t-test).

